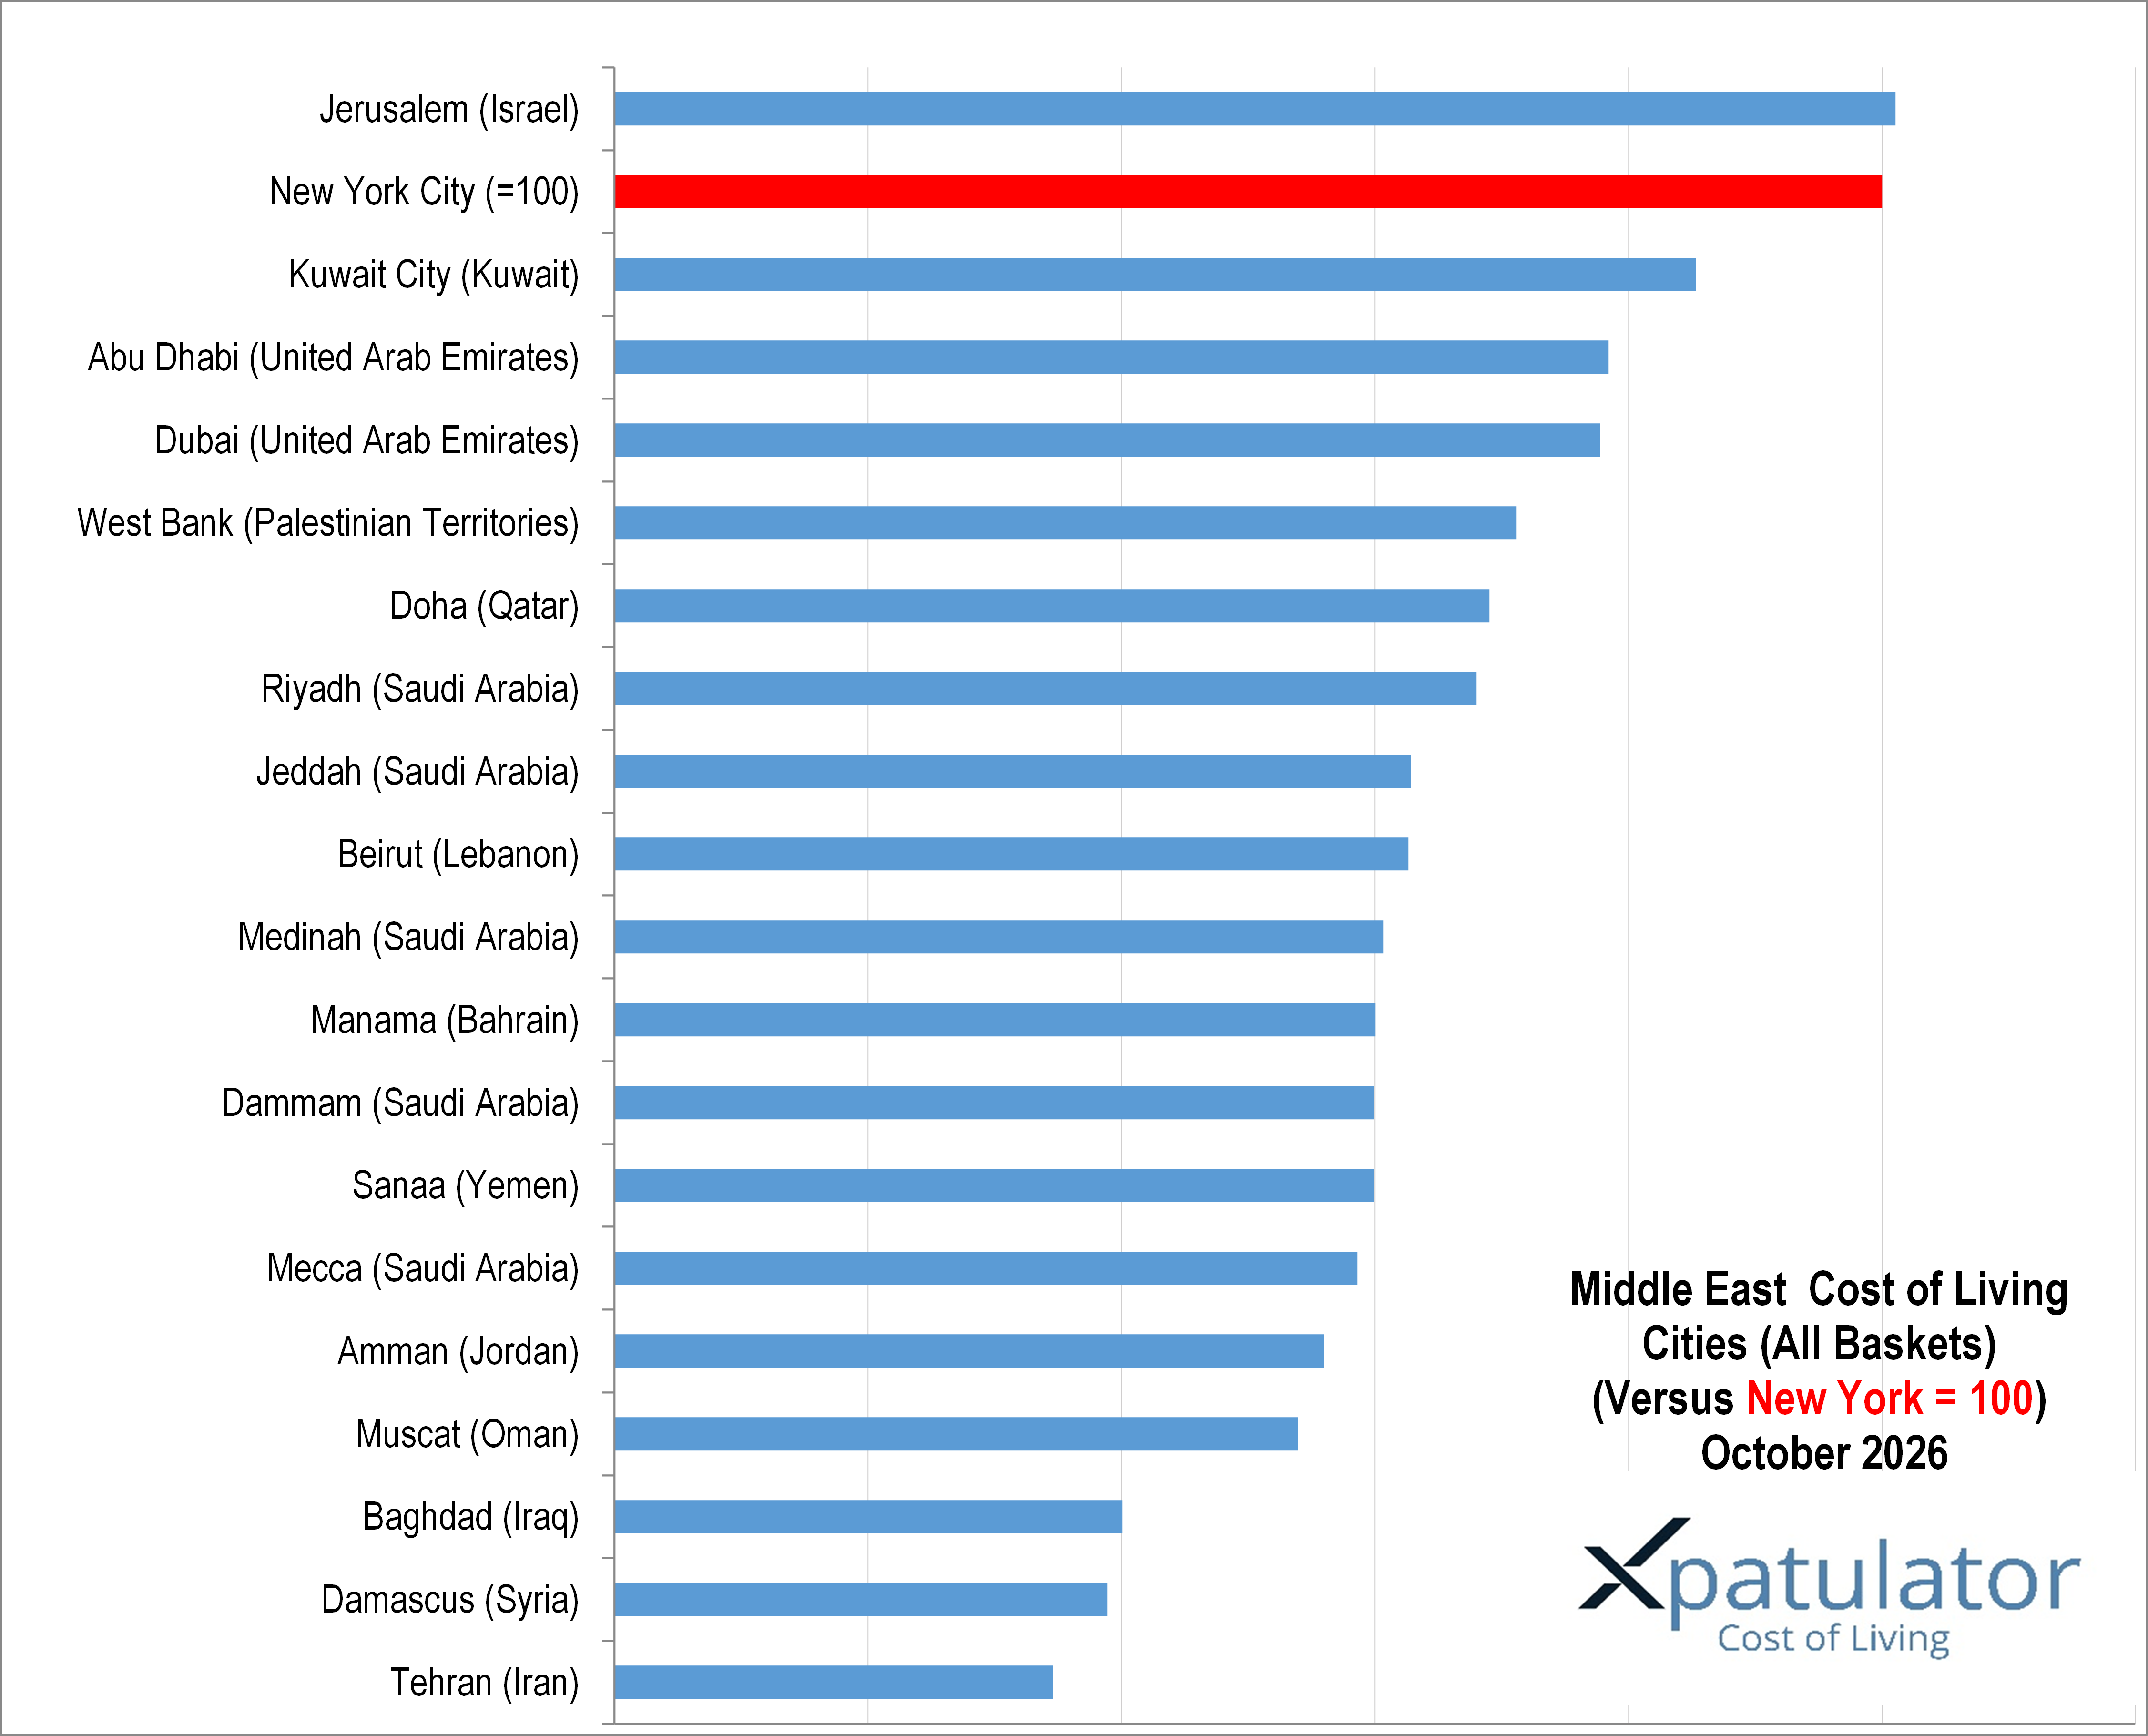
Why Exchange Rates Are Reshaping the World’s Most Expensive City Rankings

International cost of living rankings are often interpreted as a measure of inflation. In reality, exchange rates can be just as important.

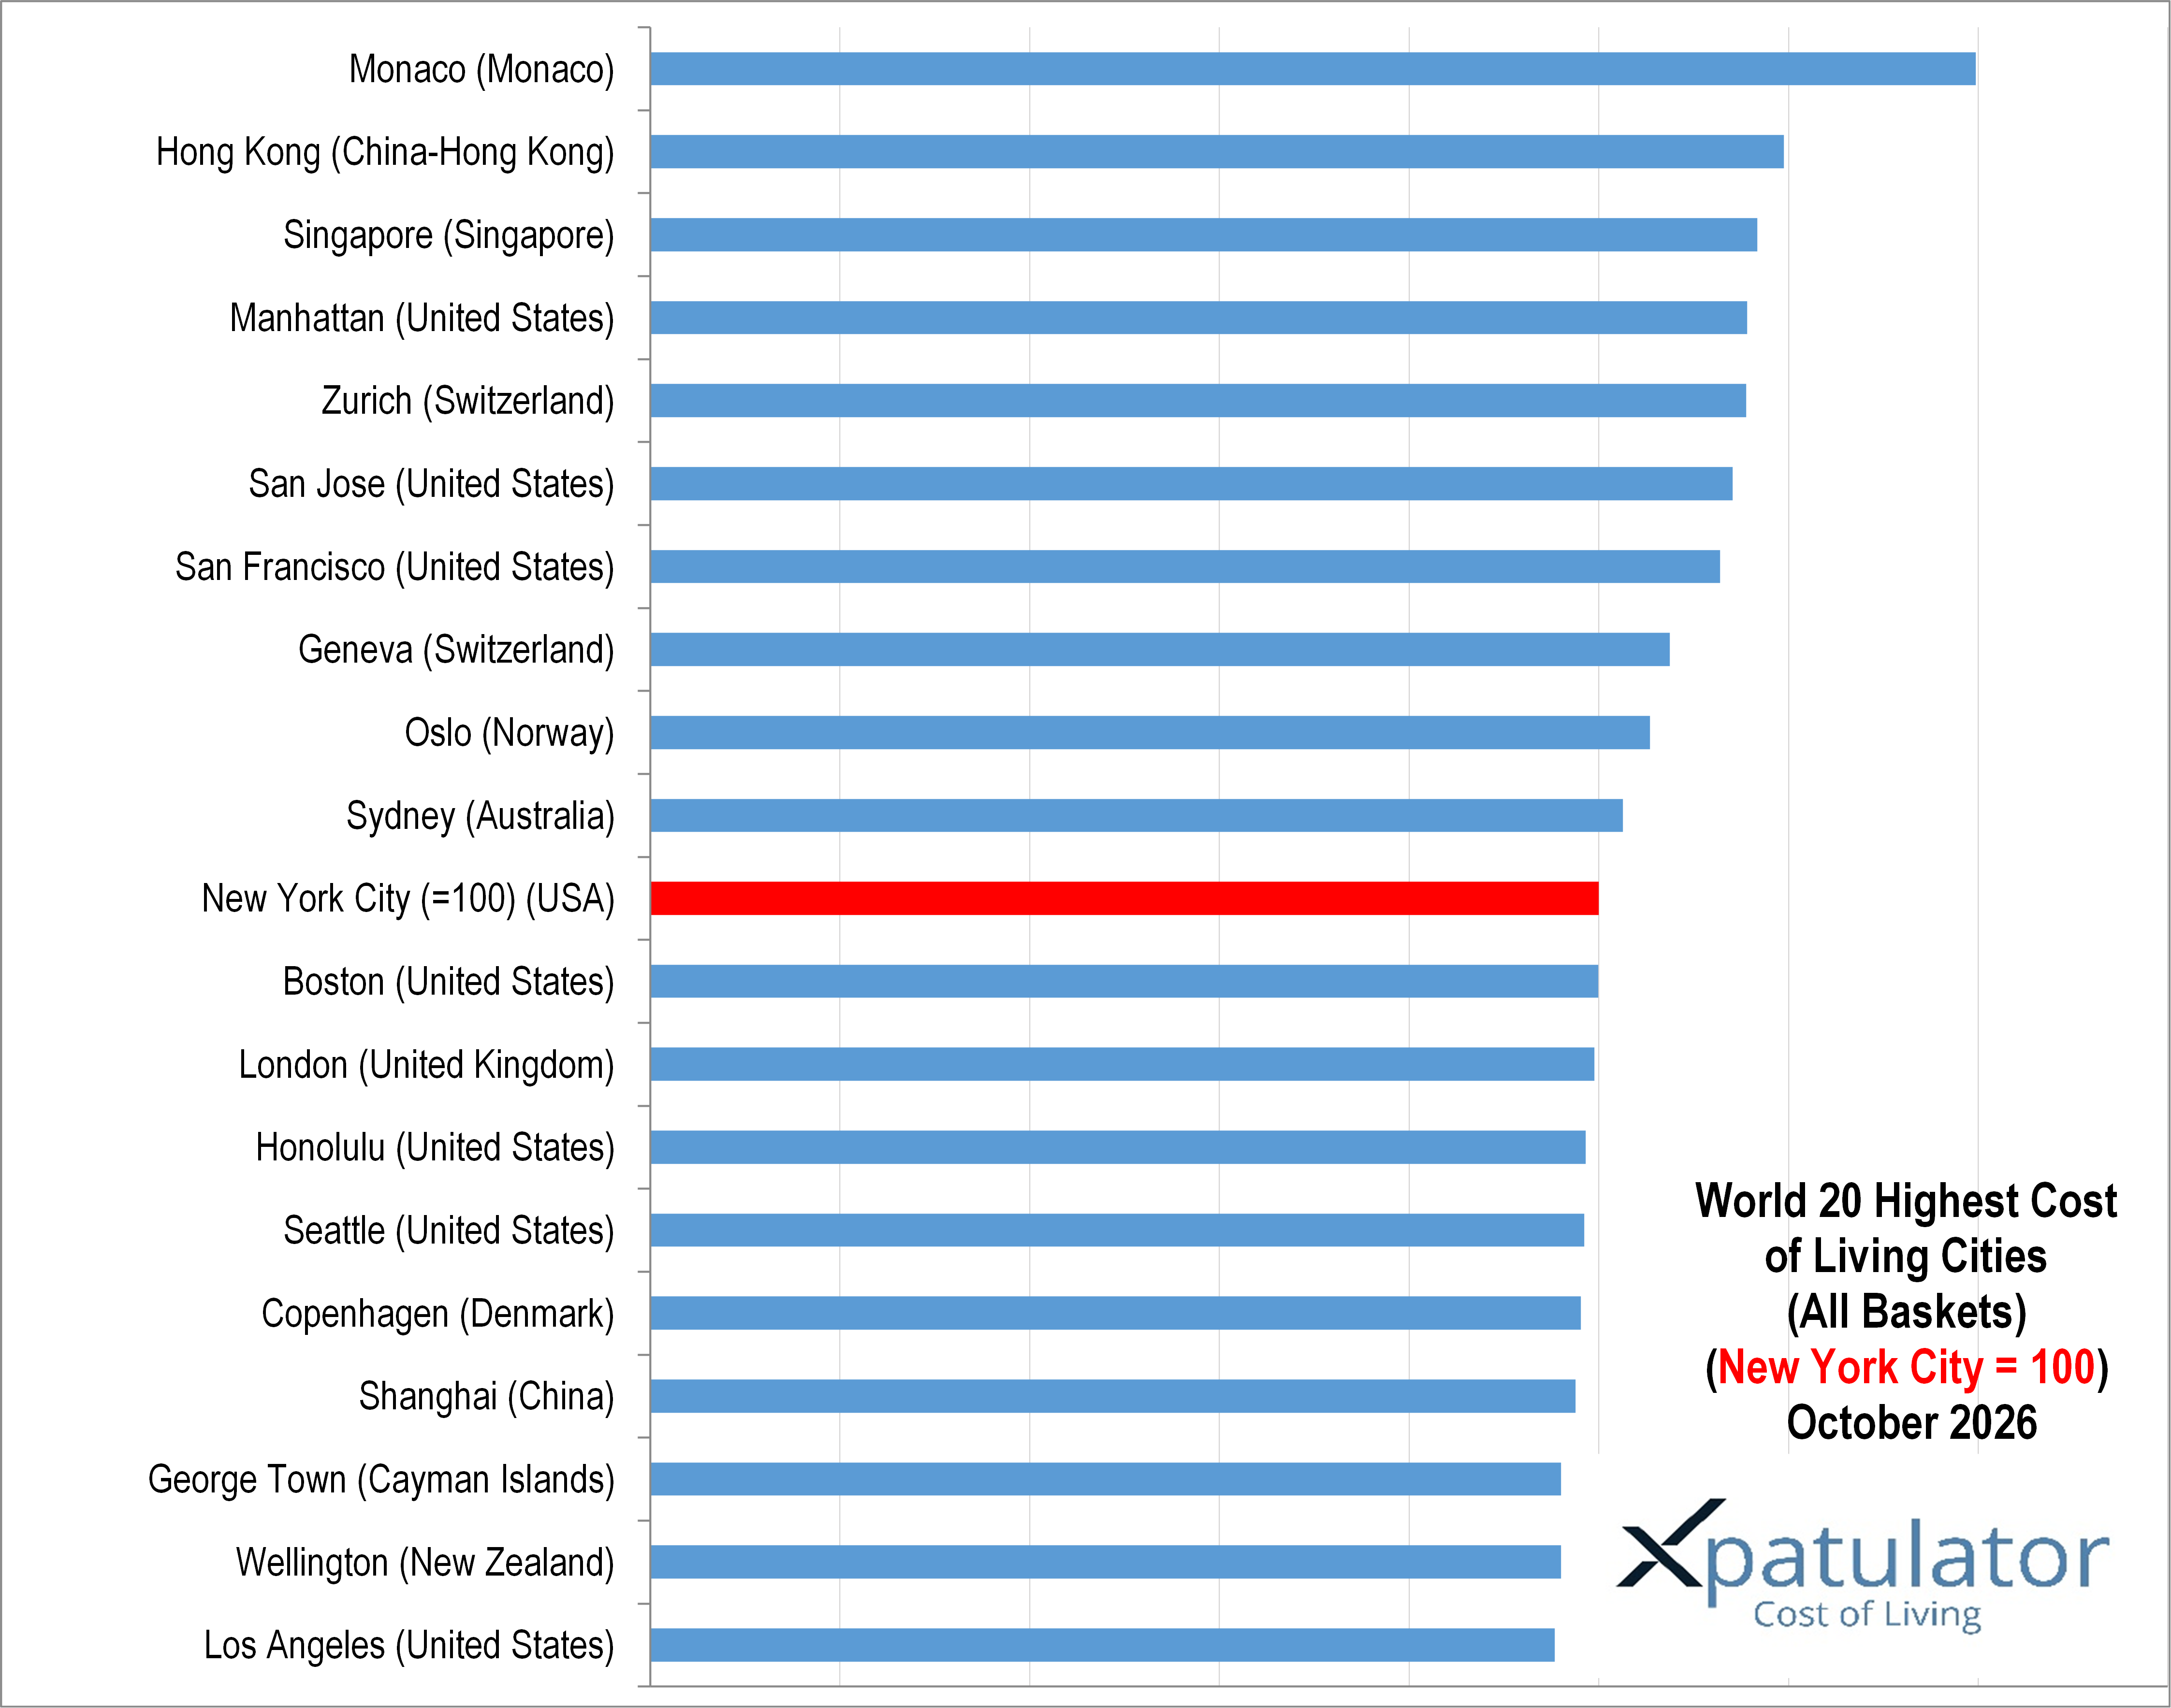
Xpatulator’s city data as at 1 October 2026 illustrates the point. Monaco remains 1st globally, Hong Kong, China 2nd and Singapore rises to 3rd. Manhattan moves to 4th while Zurich falls 2 places to 5th. Further down the ranking, London falls to 13th, Copenhagen to 16th and Wellington to 19th.

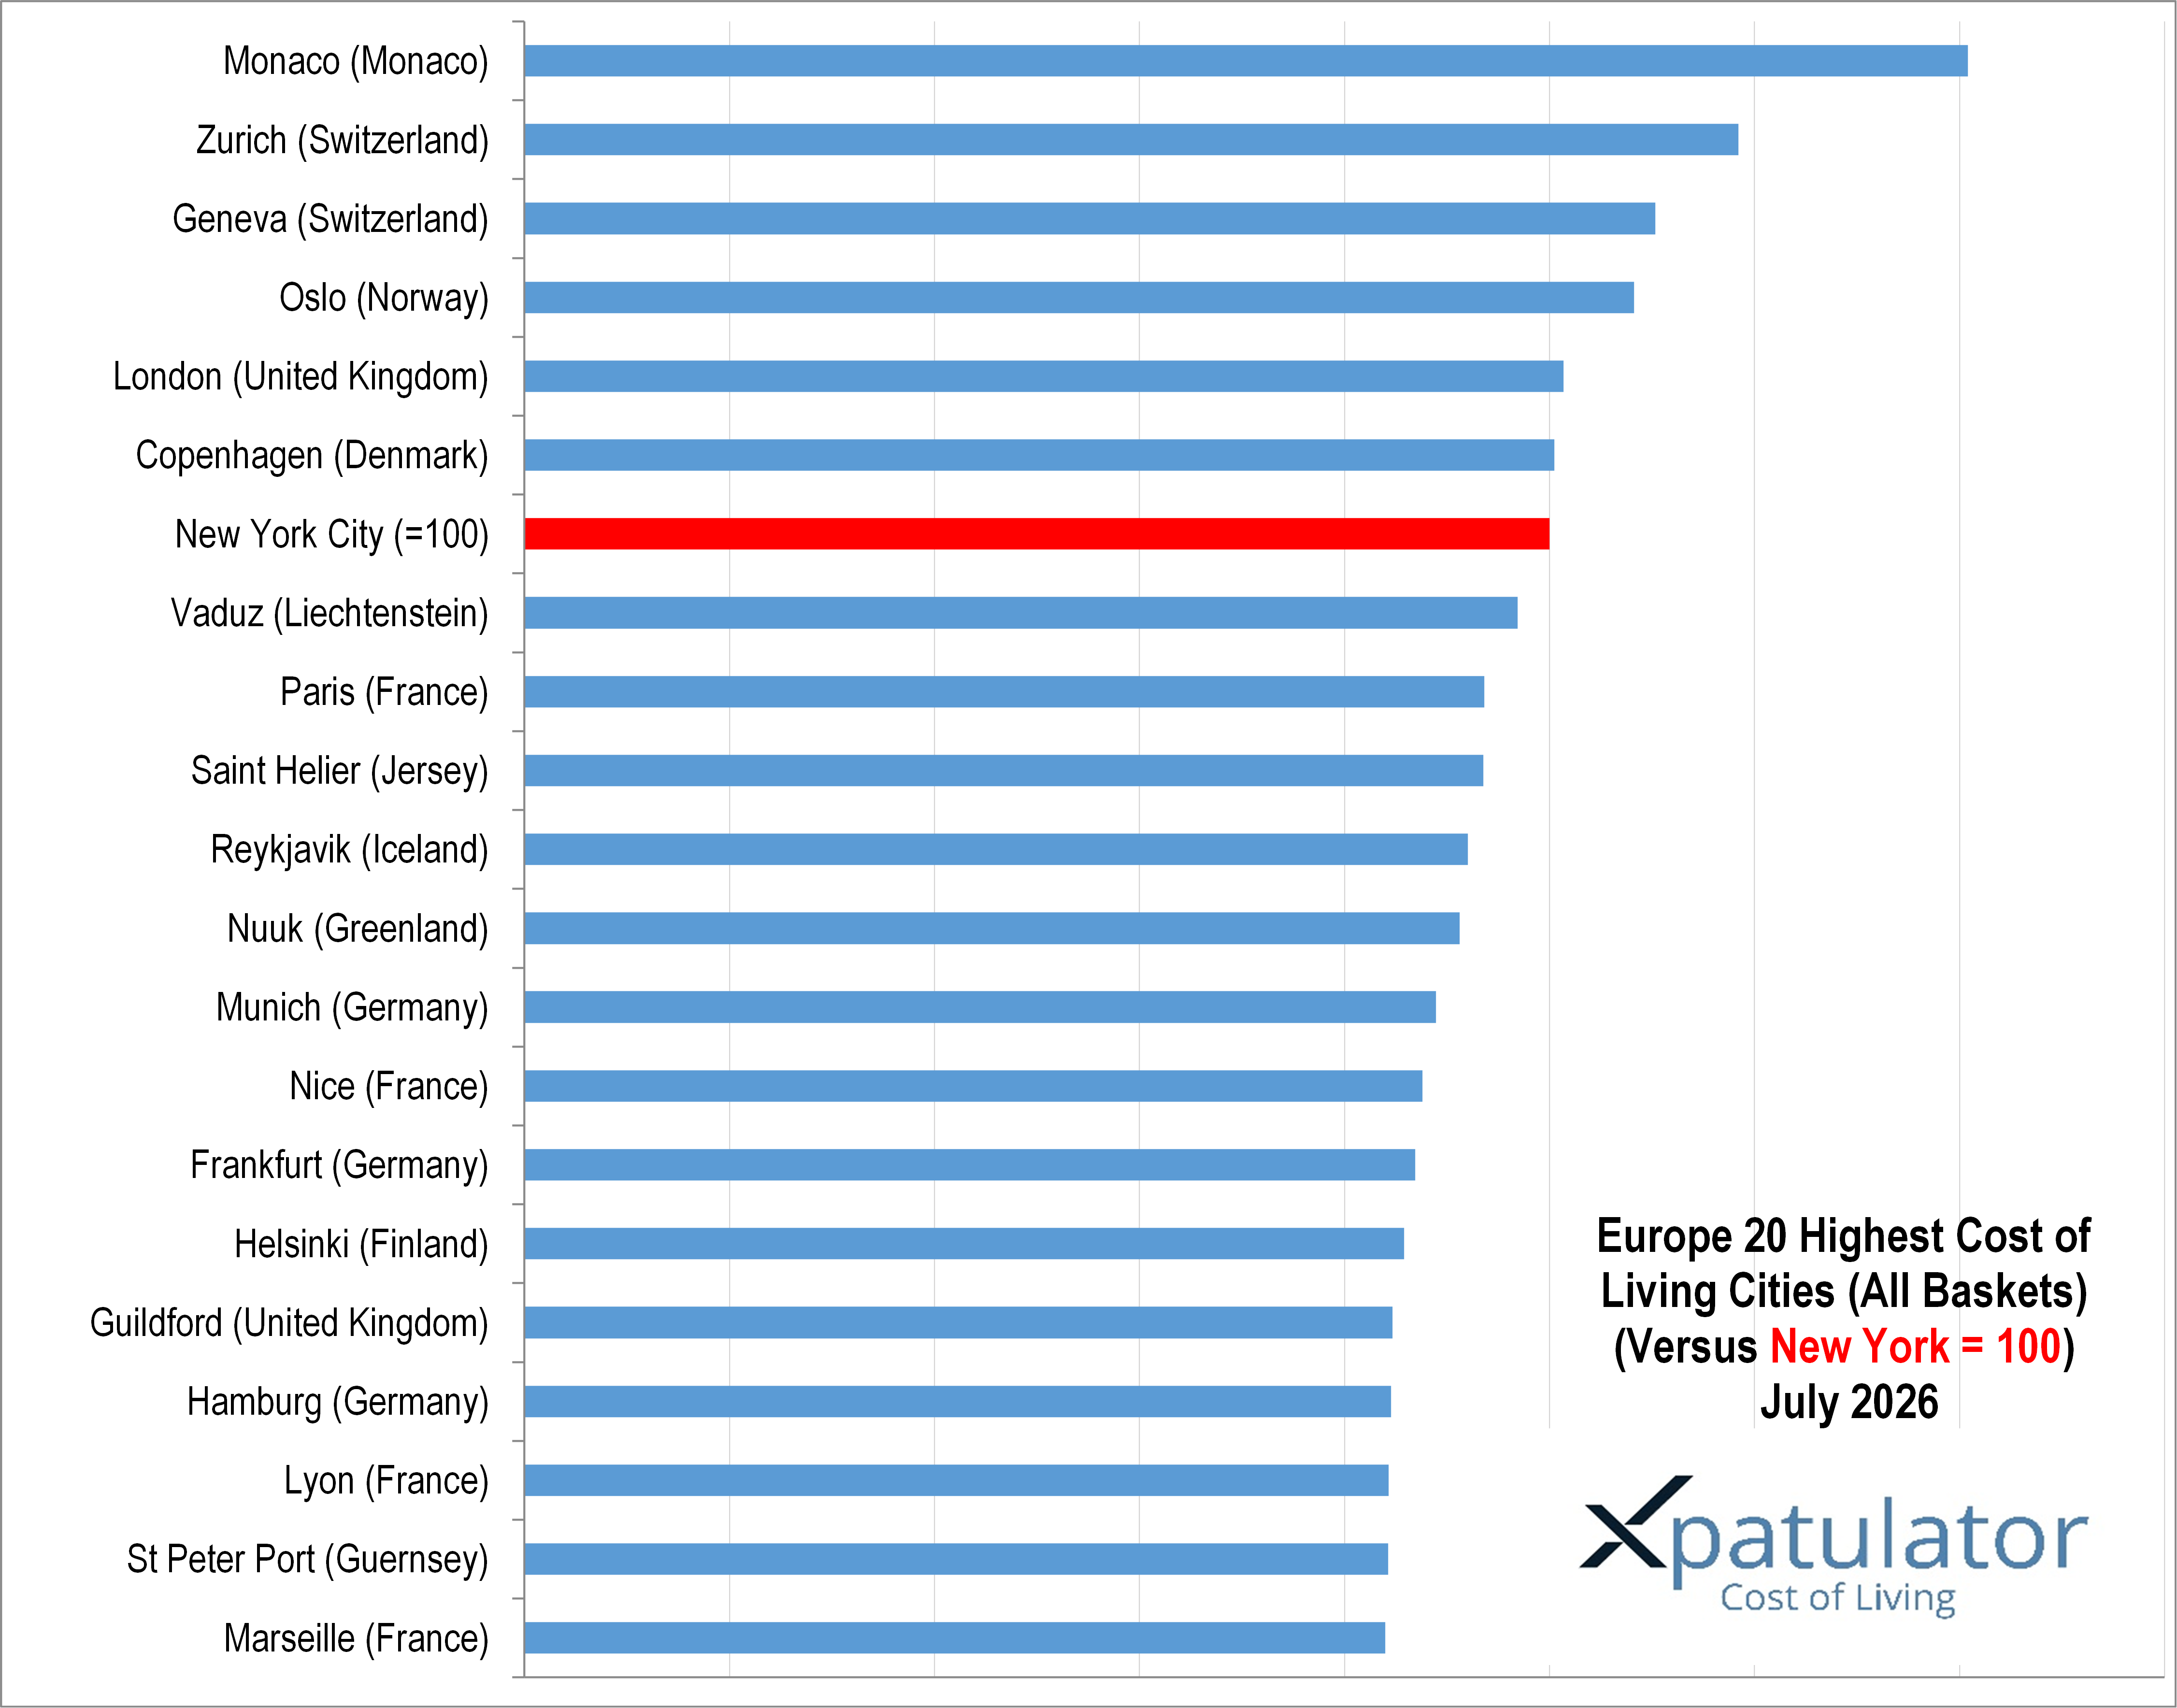
Bar chart comparing the cost of living in the 20 highest cities, with New York City as the reference point (100), displaying various cities including Monaco, Hong Kong, and Singapore, with the data presented as blue bars, and New York City highlighted in red.

Several of those changes coincide with currency movements. At the end of September 2026, the euro bought fewer United States dollars than a year earlier. The Swiss franc and pound sterling were also weaker against the United States dollar, while the New Zealand dollar declined over the same period.

A weaker host currency makes local expenditure less expensive when converted into United States dollars. This can lower a city’s international Cost of Living Index even while rents, energy and services continue to rise locally. It helps explain why Zurich, London, Copenhagen and Wellington moved lower in the rankings.

The reverse is also possible. The Australian dollar, Singapore dollar, Chinese yuan and Norwegian krone were stronger against the United States dollar at the end of September than a year earlier. A stronger host currency raises the dollar value of local expenditure, although local price movements can offset the effect. Sydney, for example, retains 10th place despite a lower index, while Shanghai rises 3 places to 17th.

Hong Kong is different because its currency operates within a linked exchange rate band of 7.75 to 7.85 Hong Kong dollars to one United States dollar. Foreign exchange therefore has much less direct influence on its ranking than in cities with freely moving currencies. Housing remains the dominant factor, with Hong Kong’s accommodation index at 179.6.

Inflation further complicates the comparison. Singapore’s consumer prices were 2.3 per cent higher in August than a year earlier. Australian inflation reached 4.0 per cent, with housing up 5.7 per cent. Euro area inflation was 3.8 per cent in September, while China continued to experience relatively subdued price pressure.

Global energy conditions are adding another layer. Middle East instability has kept oil above 100 United States dollars per barrel, while shipping and insurance costs for energy flows have increased sharply. These pressures matter well beyond oil producing regions. Higher fuel costs affect aviation, freight, food distribution and utilities, placing import dependent cities such as Honolulu, George Town, Singapore and Wellington at particular risk.

This is why a nominal salary comparison can be misleading. An employee may receive a higher salary after moving abroad but still have less disposable income if housing, education, healthcare and transport are more expensive or if the host currency strengthens.

A useful comparison therefore asks how much salary is required in the host location to buy the same basket of goods and services as at home. Xpatulator’s Salary Purchasing Power Parity Calculator is designed for precisely this purpose, converting cost of living differences into an equivalent host salary so that an international offer can be assessed in terms of actual purchasing power rather than its headline amount.

Posted in Uncategorized | Tagged , , , , , | Leave a comment

Why Asia Pacific Cost of Living Rankings Are Moving Differently from Inflation

A city’s cost of living ranking can fall even while its residents face higher inflation. Xpatulator’s Asia Pacific data as at 1 October 2026 provides several examples.

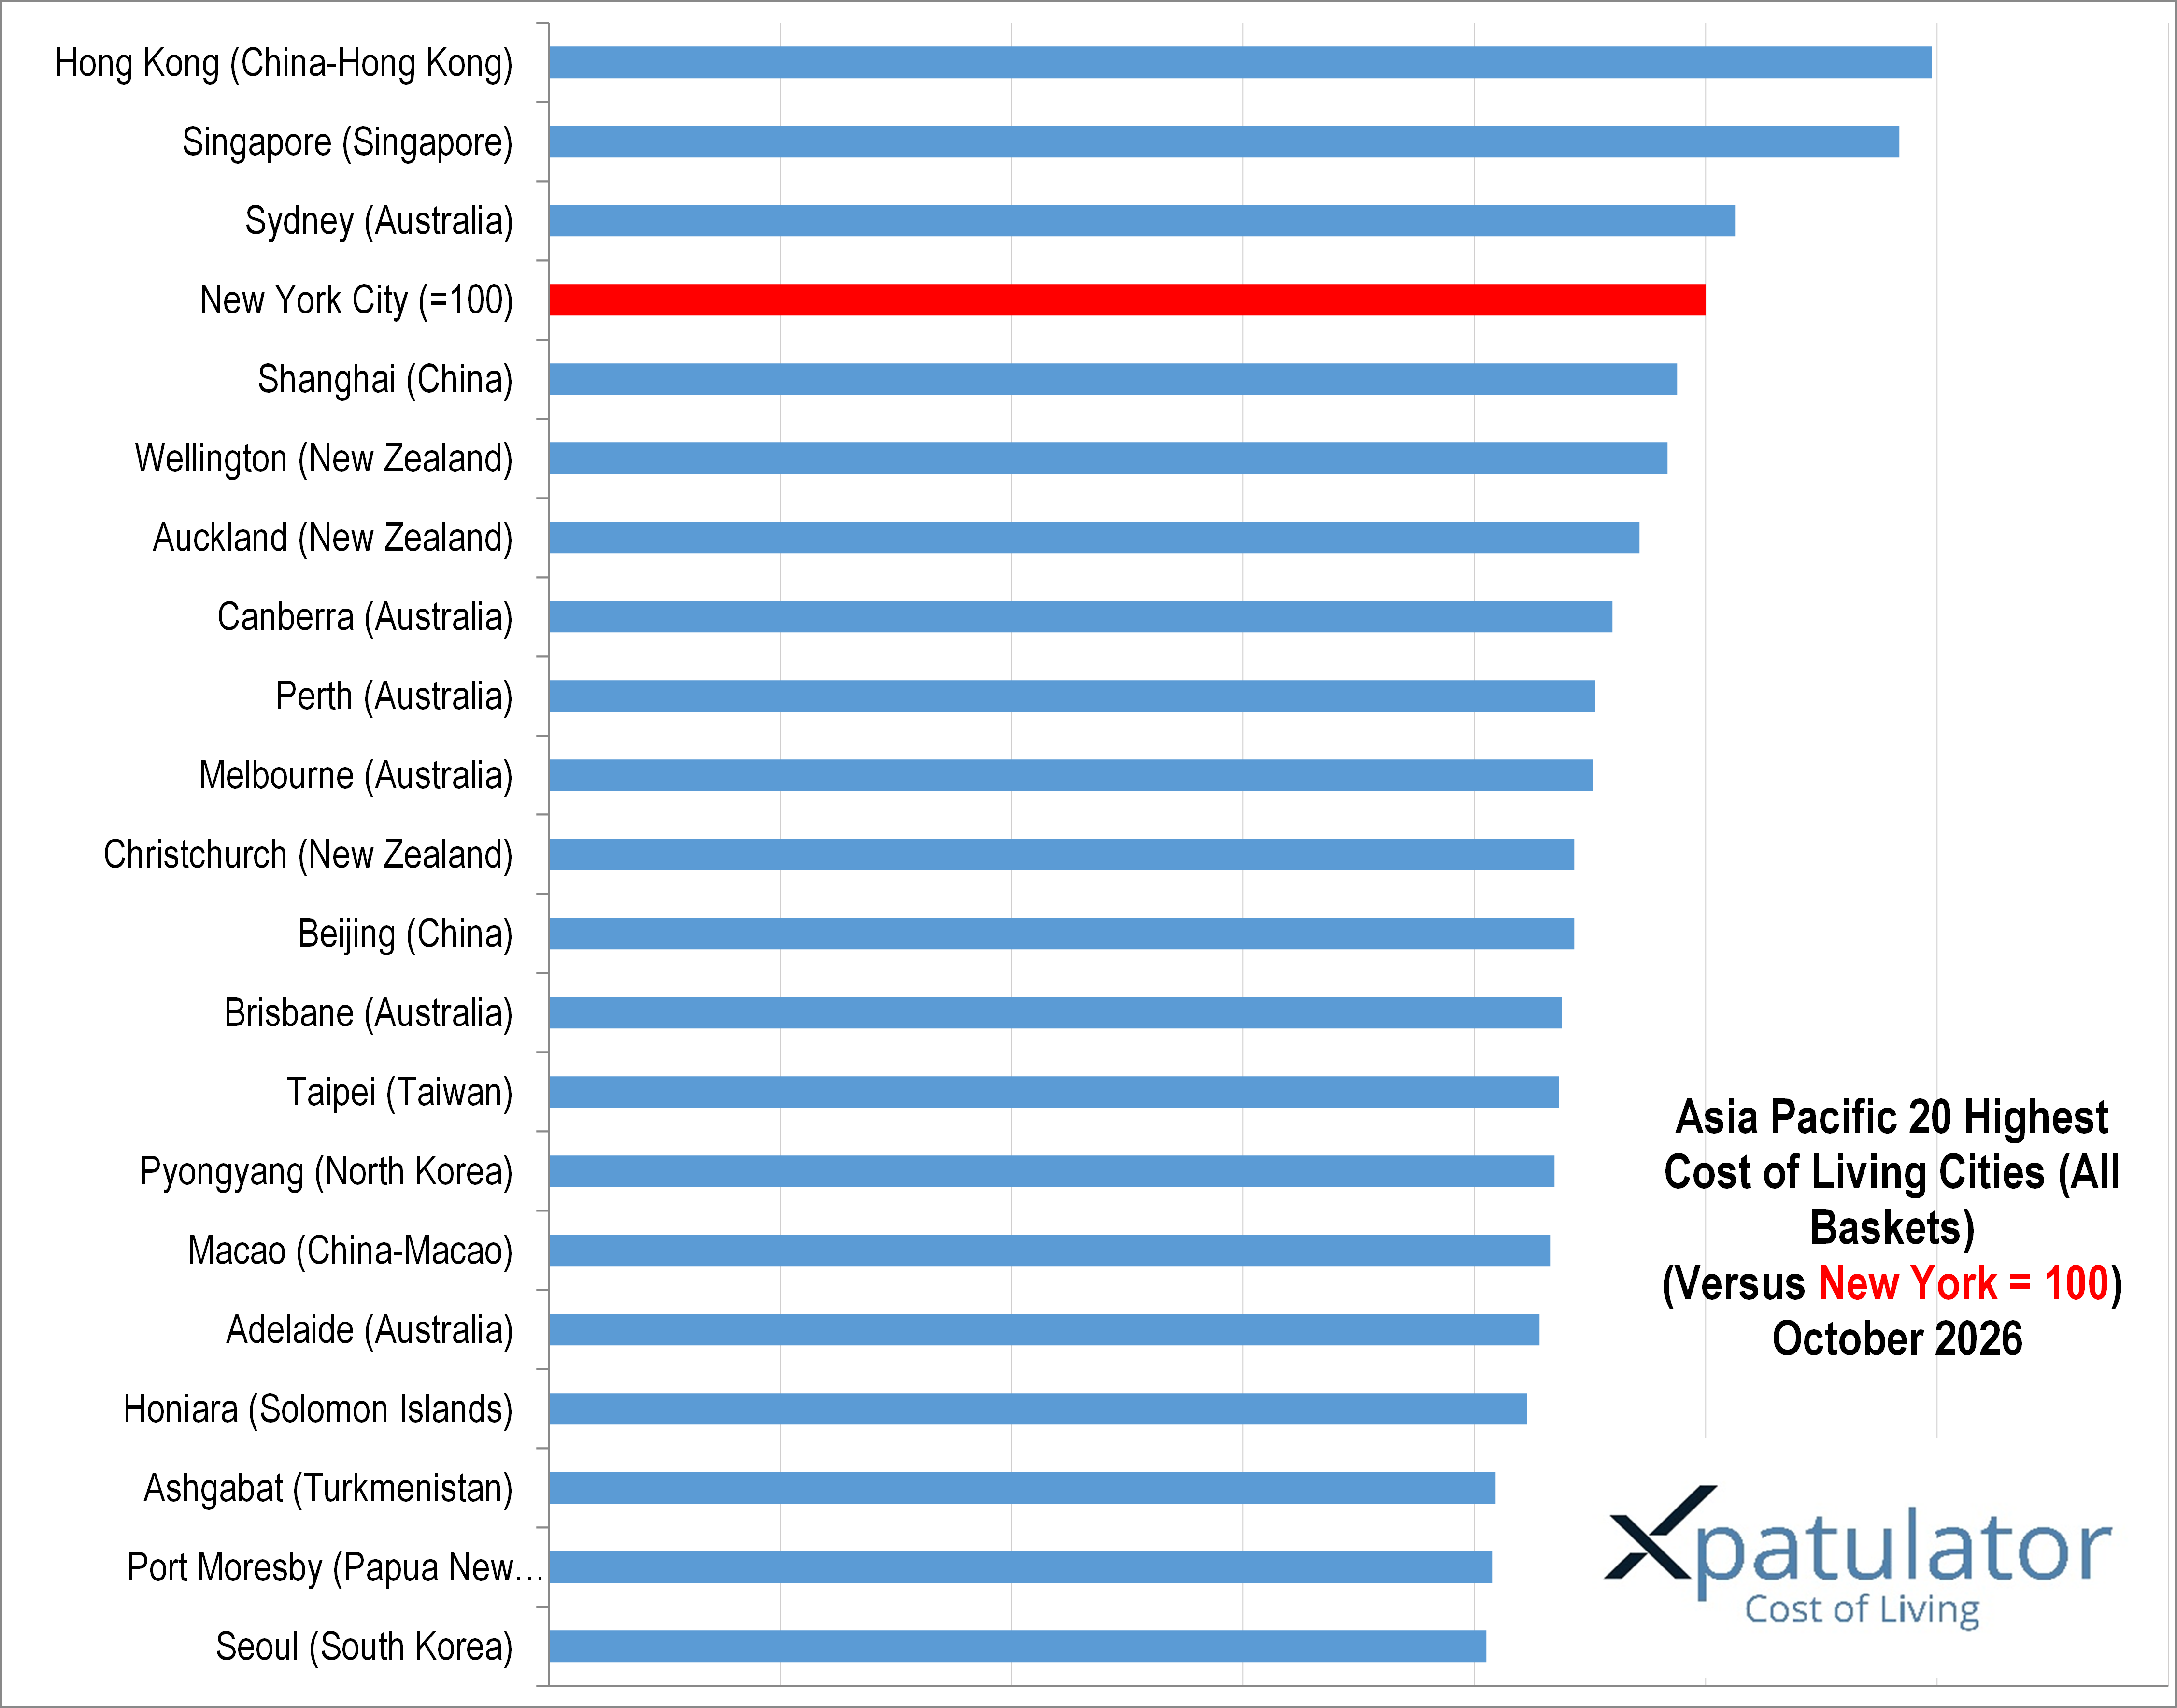
Sydney remains 3rd in the region, but its Cost of Living Index declines from 106.4 in July to 102.5. Canberra, Perth, Melbourne, Brisbane and Adelaide also record lower indexes. Yet Australian consumer inflation accelerated to 4.0 per cent in August, with housing up 5.7 per cent over the year.

New Zealand is similar. Wellington’s index falls from 100.3 to 96.7 and Auckland from 97.9 to 94.3. New Zealand consumer inflation, however, reached 4.1 per cent in June, its highest level since early 2024, with fuel and electricity important contributors.

The difference comes partly from exchange rates. International cost comparisons need to translate prices between currencies. The New Zealand dollar bought 0.57825 United States dollars on 30 September 2025 but only 0.56405 a year later. For someone paid in United States dollars, the same amount of New Zealand dollar spending therefore became cheaper in dollar terms. For a locally paid household, the weaker currency can instead raise import prices.

China shows the reverse mechanism. The yuan strengthened during 2026 and reached its strongest level in more than three years against the United States dollar in September. Shanghai rises 2 places to 4th and Beijing rises 2 places to 11th, although subdued domestic demand continues to restrain general consumer price pressure. A stronger currency can increase international costs even when local inflation is relatively modest.

Hong Kong, China and Singapore are different again. Hong Kong’s currency is linked closely to the United States dollar, so foreign exchange contributes relatively little to ranking changes. Accommodation remains the dominant cost, and renewed recruitment in finance and professional services is supporting demand for internationally suitable housing. Singapore manages its currency against a basket of trading partners and is considering tighter monetary settings as inflation risks rise.

Smaller locations highlight the role of logistics. Honiara faces higher inflation partly because of imported energy costs. Port Moresby remains affected by foreign exchange availability, imported goods and the cost of suitable accommodation and transport. Ashgabat operates with a more restricted market and dual exchange rates, making international price comparison less straightforward.

Geopolitical developments add another layer. Oil remains above 100 United States dollars per barrel amid Middle East instability, while global food prices reached their highest level in almost four years in September. Import dependent Asia Pacific economies are particularly exposed because higher energy and freight costs feed into groceries, utilities and transport.

This is why inflation alone is not sufficient when assessing an international salary. An expatriate needs to compare the actual cost of the goods and services funded from salary in the home and host locations, together with exchange rates and major fixed costs such as accommodation and education.

Xpatulator’s Salary Purchasing Power Parity Calculator provides that comparison by estimating the host salary required to preserve purchasing power. It offers a more meaningful measure of an international job offer than comparing nominal salaries or applying a general inflation adjustment alone.

Posted in Uncategorized | Tagged , , , , , , , , , | Leave a comment

Why Island Cities Rank Among America’s Most Expensive Expatriate Locations

America’s most expensive expatriate locations include some of the world’s largest metropolitan economies, but the top rankings also contain a notable group of small island cities.

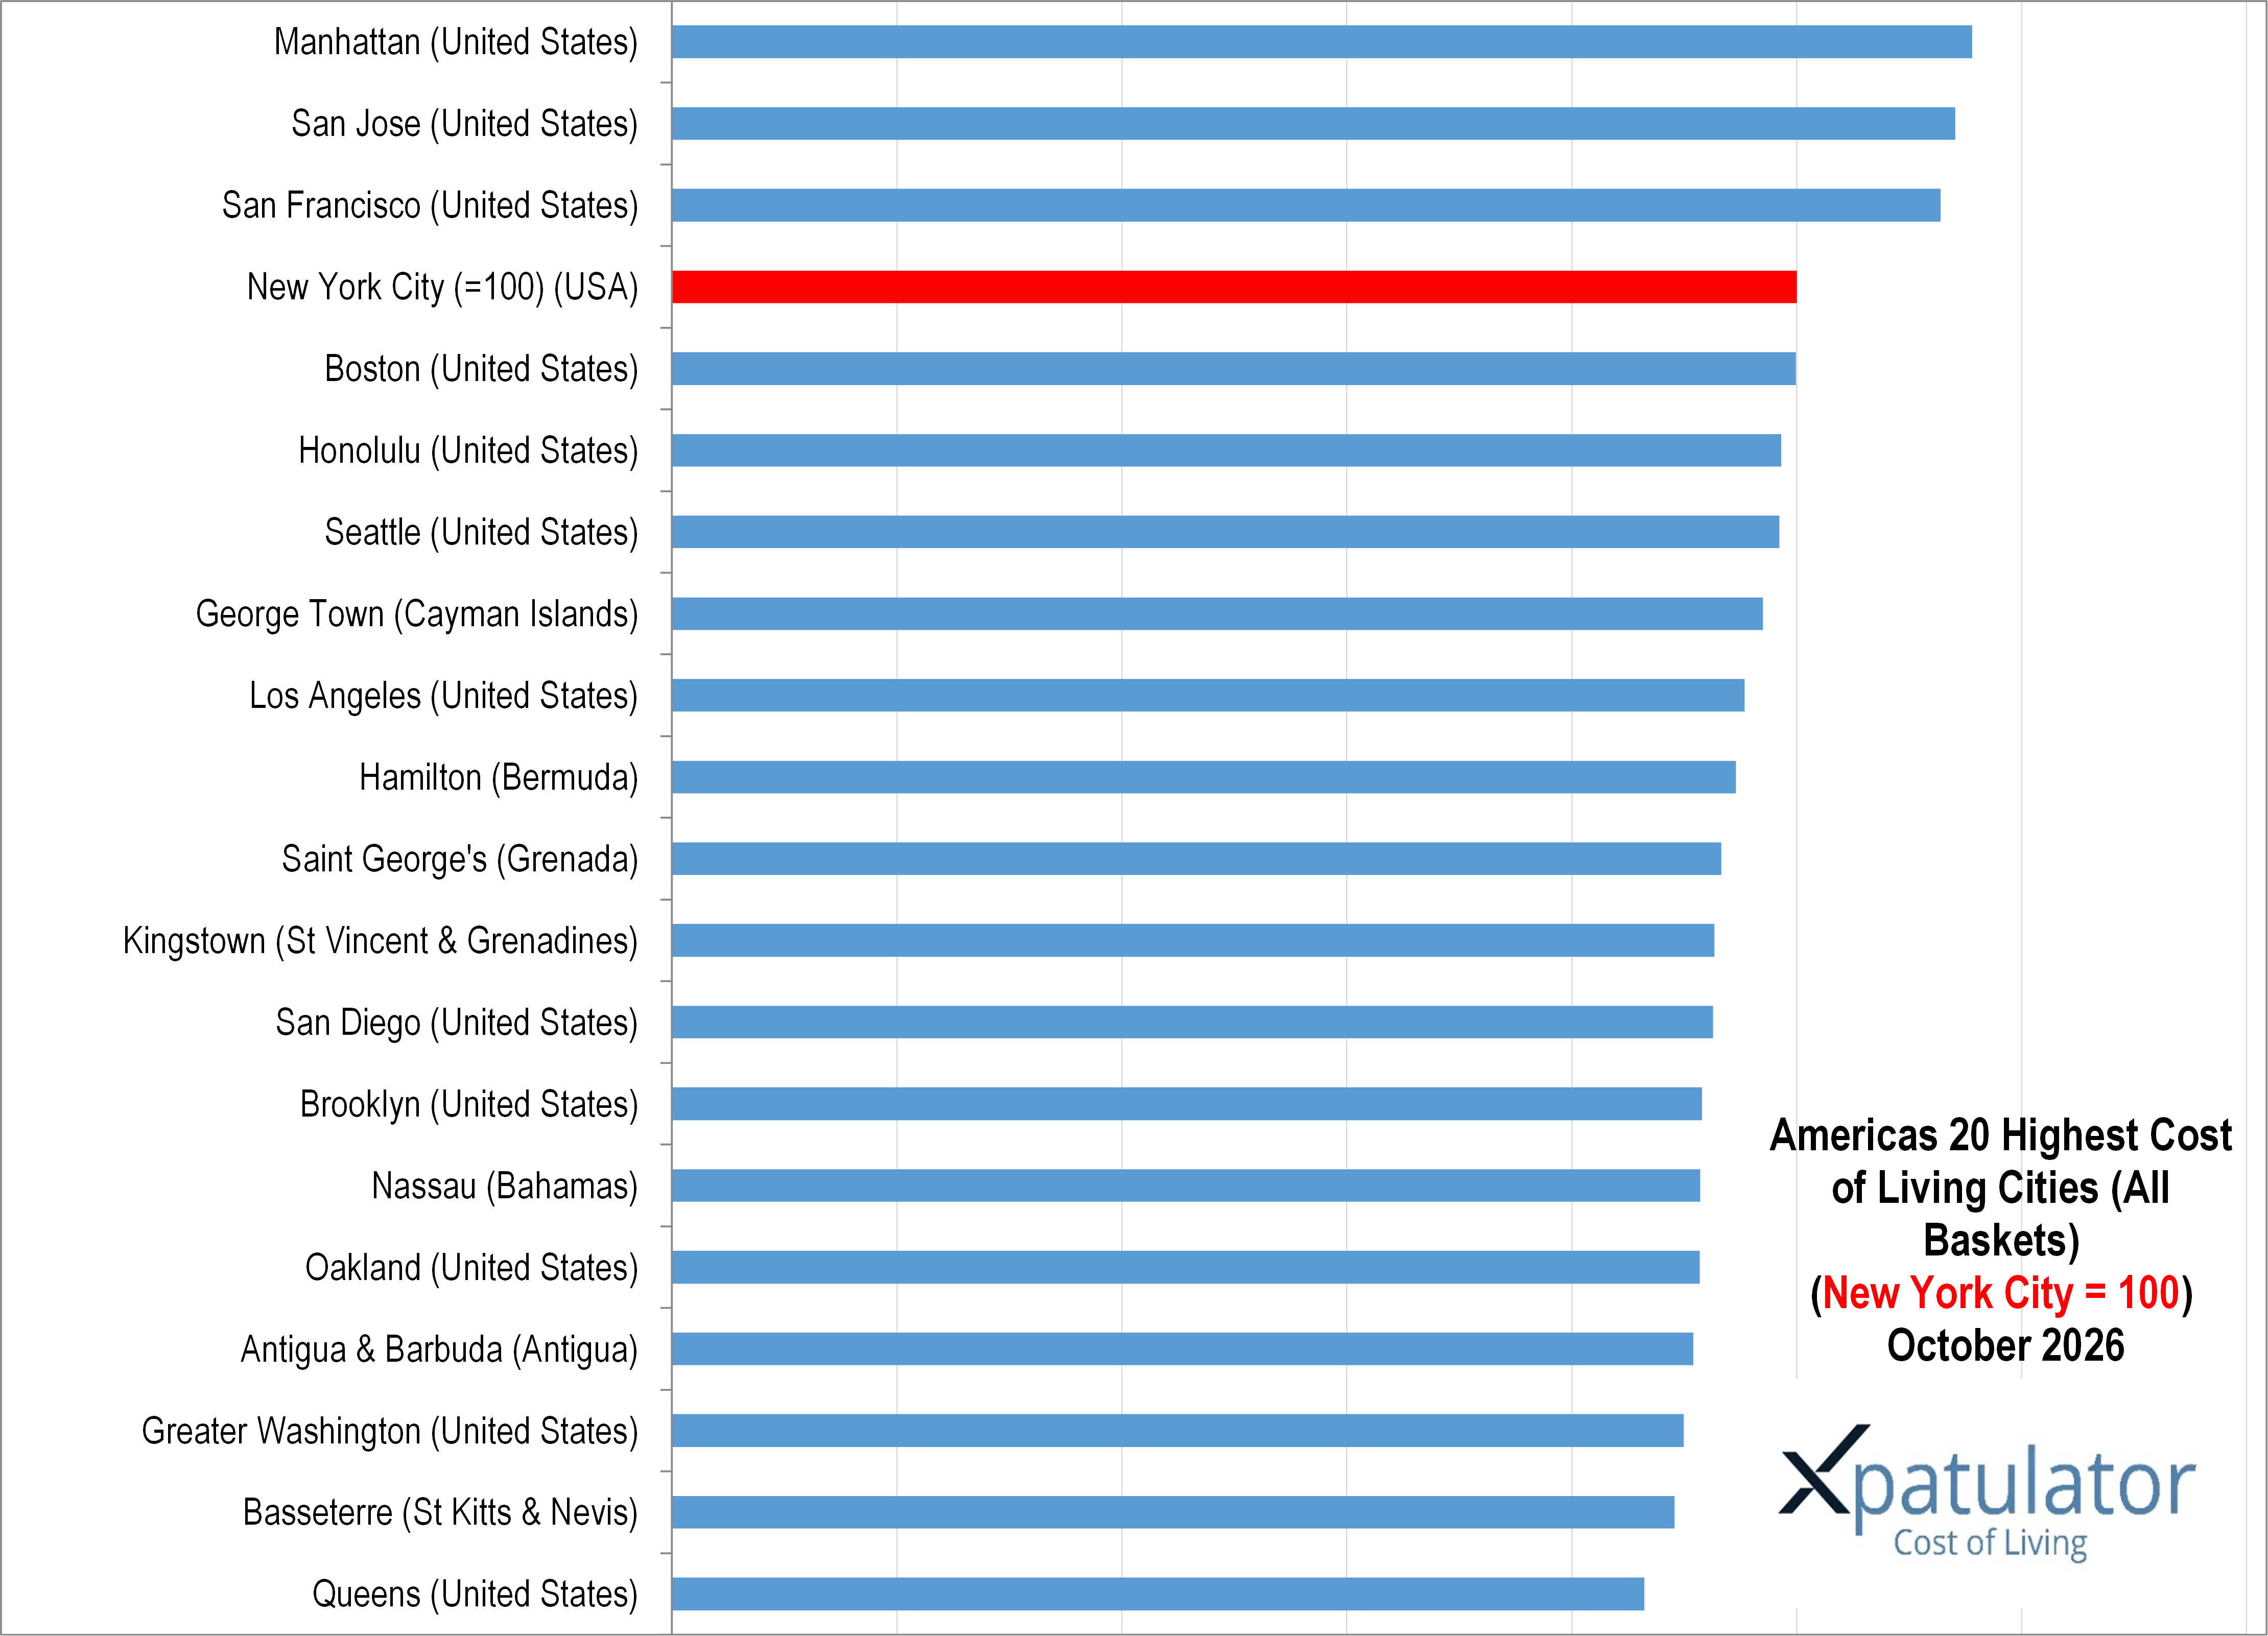
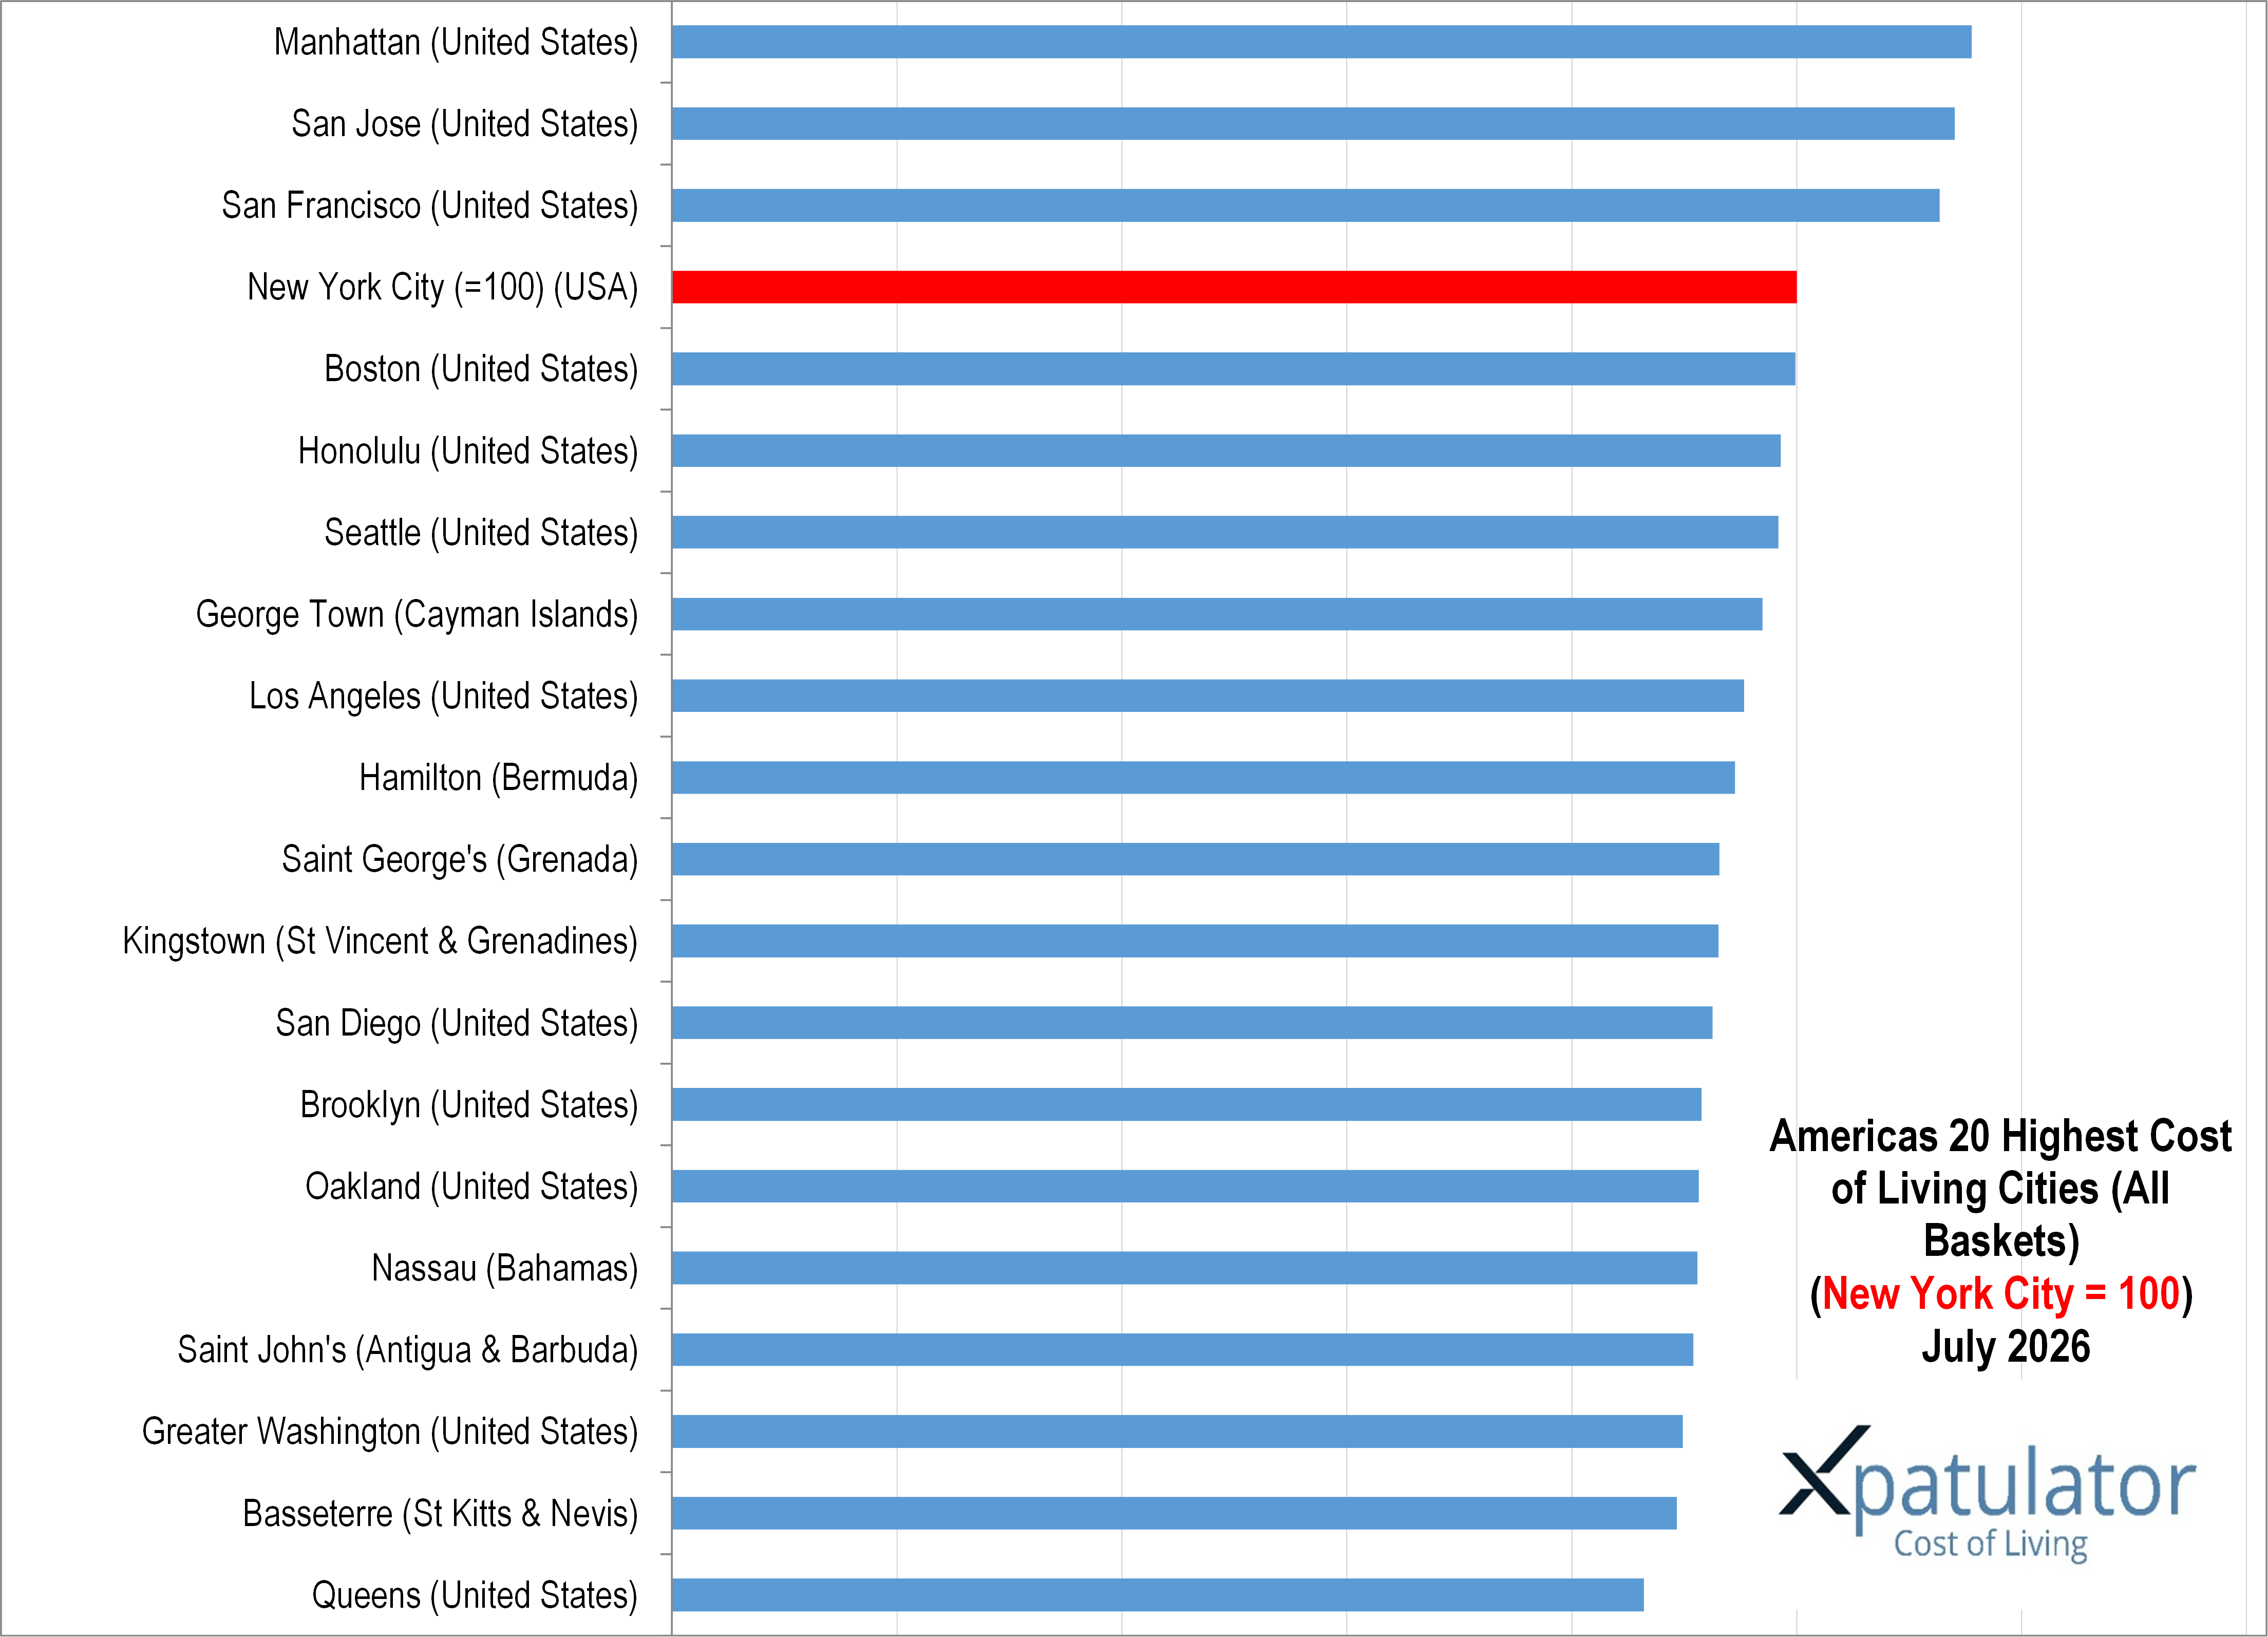
Xpatulator’s data as at 1 October 2026 places Manhattan 1st, San Jose 2nd and San Francisco 3rd. Yet George Town in the Cayman Islands ranks 8th, Hamilton in Bermuda 10th, Saint George’s in Grenada 11th and Kingstown in Saint Vincent and the Grenadines 12th. Nassau, Saint John’s and Basseterre also appear in the top 20.

Bar chart displaying the 20 cities in the Americas with the highest cost of living as of October 2026, using New York City as the benchmark (100).

The reasons are different from those in Manhattan or Silicon Valley. In the United States technology and financial centres, high incomes compete for constrained housing while healthcare, transport and labour intensive services are costly. Manhattan rents reached record levels during 2026, while San Jose rents were almost 10 per cent higher in August than a year earlier.

Island economies face a different constraint. A large proportion of food, vehicles, furniture, appliances and consumer products must be transported from elsewhere. Freight, insurance, storage and distribution become part of the retail price. Smaller populations also mean fewer suppliers over which to spread fixed operating costs.

The Xpatulator data reflects this clearly. Communication and transport are particularly expensive in George Town. Hamilton combines high communication and grocery costs. Transport dominates much of the expenditure premium in Saint George’s and Kingstown, while Nassau records high communication and grocery costs.

Domestic inflation can reinforce these structural pressures. Cayman Islands consumer prices increased 2.8 per cent in the first quarter of 2026, while Bermuda recorded annual inflation of 2.5 per cent in April. Bahamian inflation was 2.7 per cent in February.

Currency risk is comparatively limited. Bermuda and the Bahamas maintain one to one parity with the United States dollar, the Cayman Islands dollar is fixed against it, and the Eastern Caribbean dollar has remained fixed at 2.70 to one United States dollar for 50 years. A United States dollar paid expatriate is therefore largely protected from exchange rate volatility in these locations. The trade off is that there is little currency depreciation available to offset rising local prices.

Weather and insurance are another consideration. Hurricane exposure can raise property insurance and resilience costs and can temporarily interrupt shipping and energy supply. The arrival of Hurricane Isaias in early October 2026, which disrupted Gulf of Mexico oil and gas production, illustrates how severe weather can also influence energy and logistics costs across a wider region.

For an expatriate, the implication is that an island assignment should not be assumed to be inexpensive because the local population or economy is small. The relevant comparison is the price of the particular goods and services that the employee and family will need.

Xpatulator’s Salary Purchasing Power Parity Calculator compares those costs with the employee’s home location and estimates the host salary required to maintain a comparable standard of living. That provides a stronger basis for evaluating an overseas offer than comparing nominal salaries or exchange rates alone.

Posted in Uncategorized | Tagged | Leave a comment

Why European Cities Became Cheaper in Dollar Terms While Inflation Increased

Europe’s cost of living data during the third quarter of 2026 presents an apparent contradiction. Many leading cities became less expensive in international comparisons, while inflation accelerated.

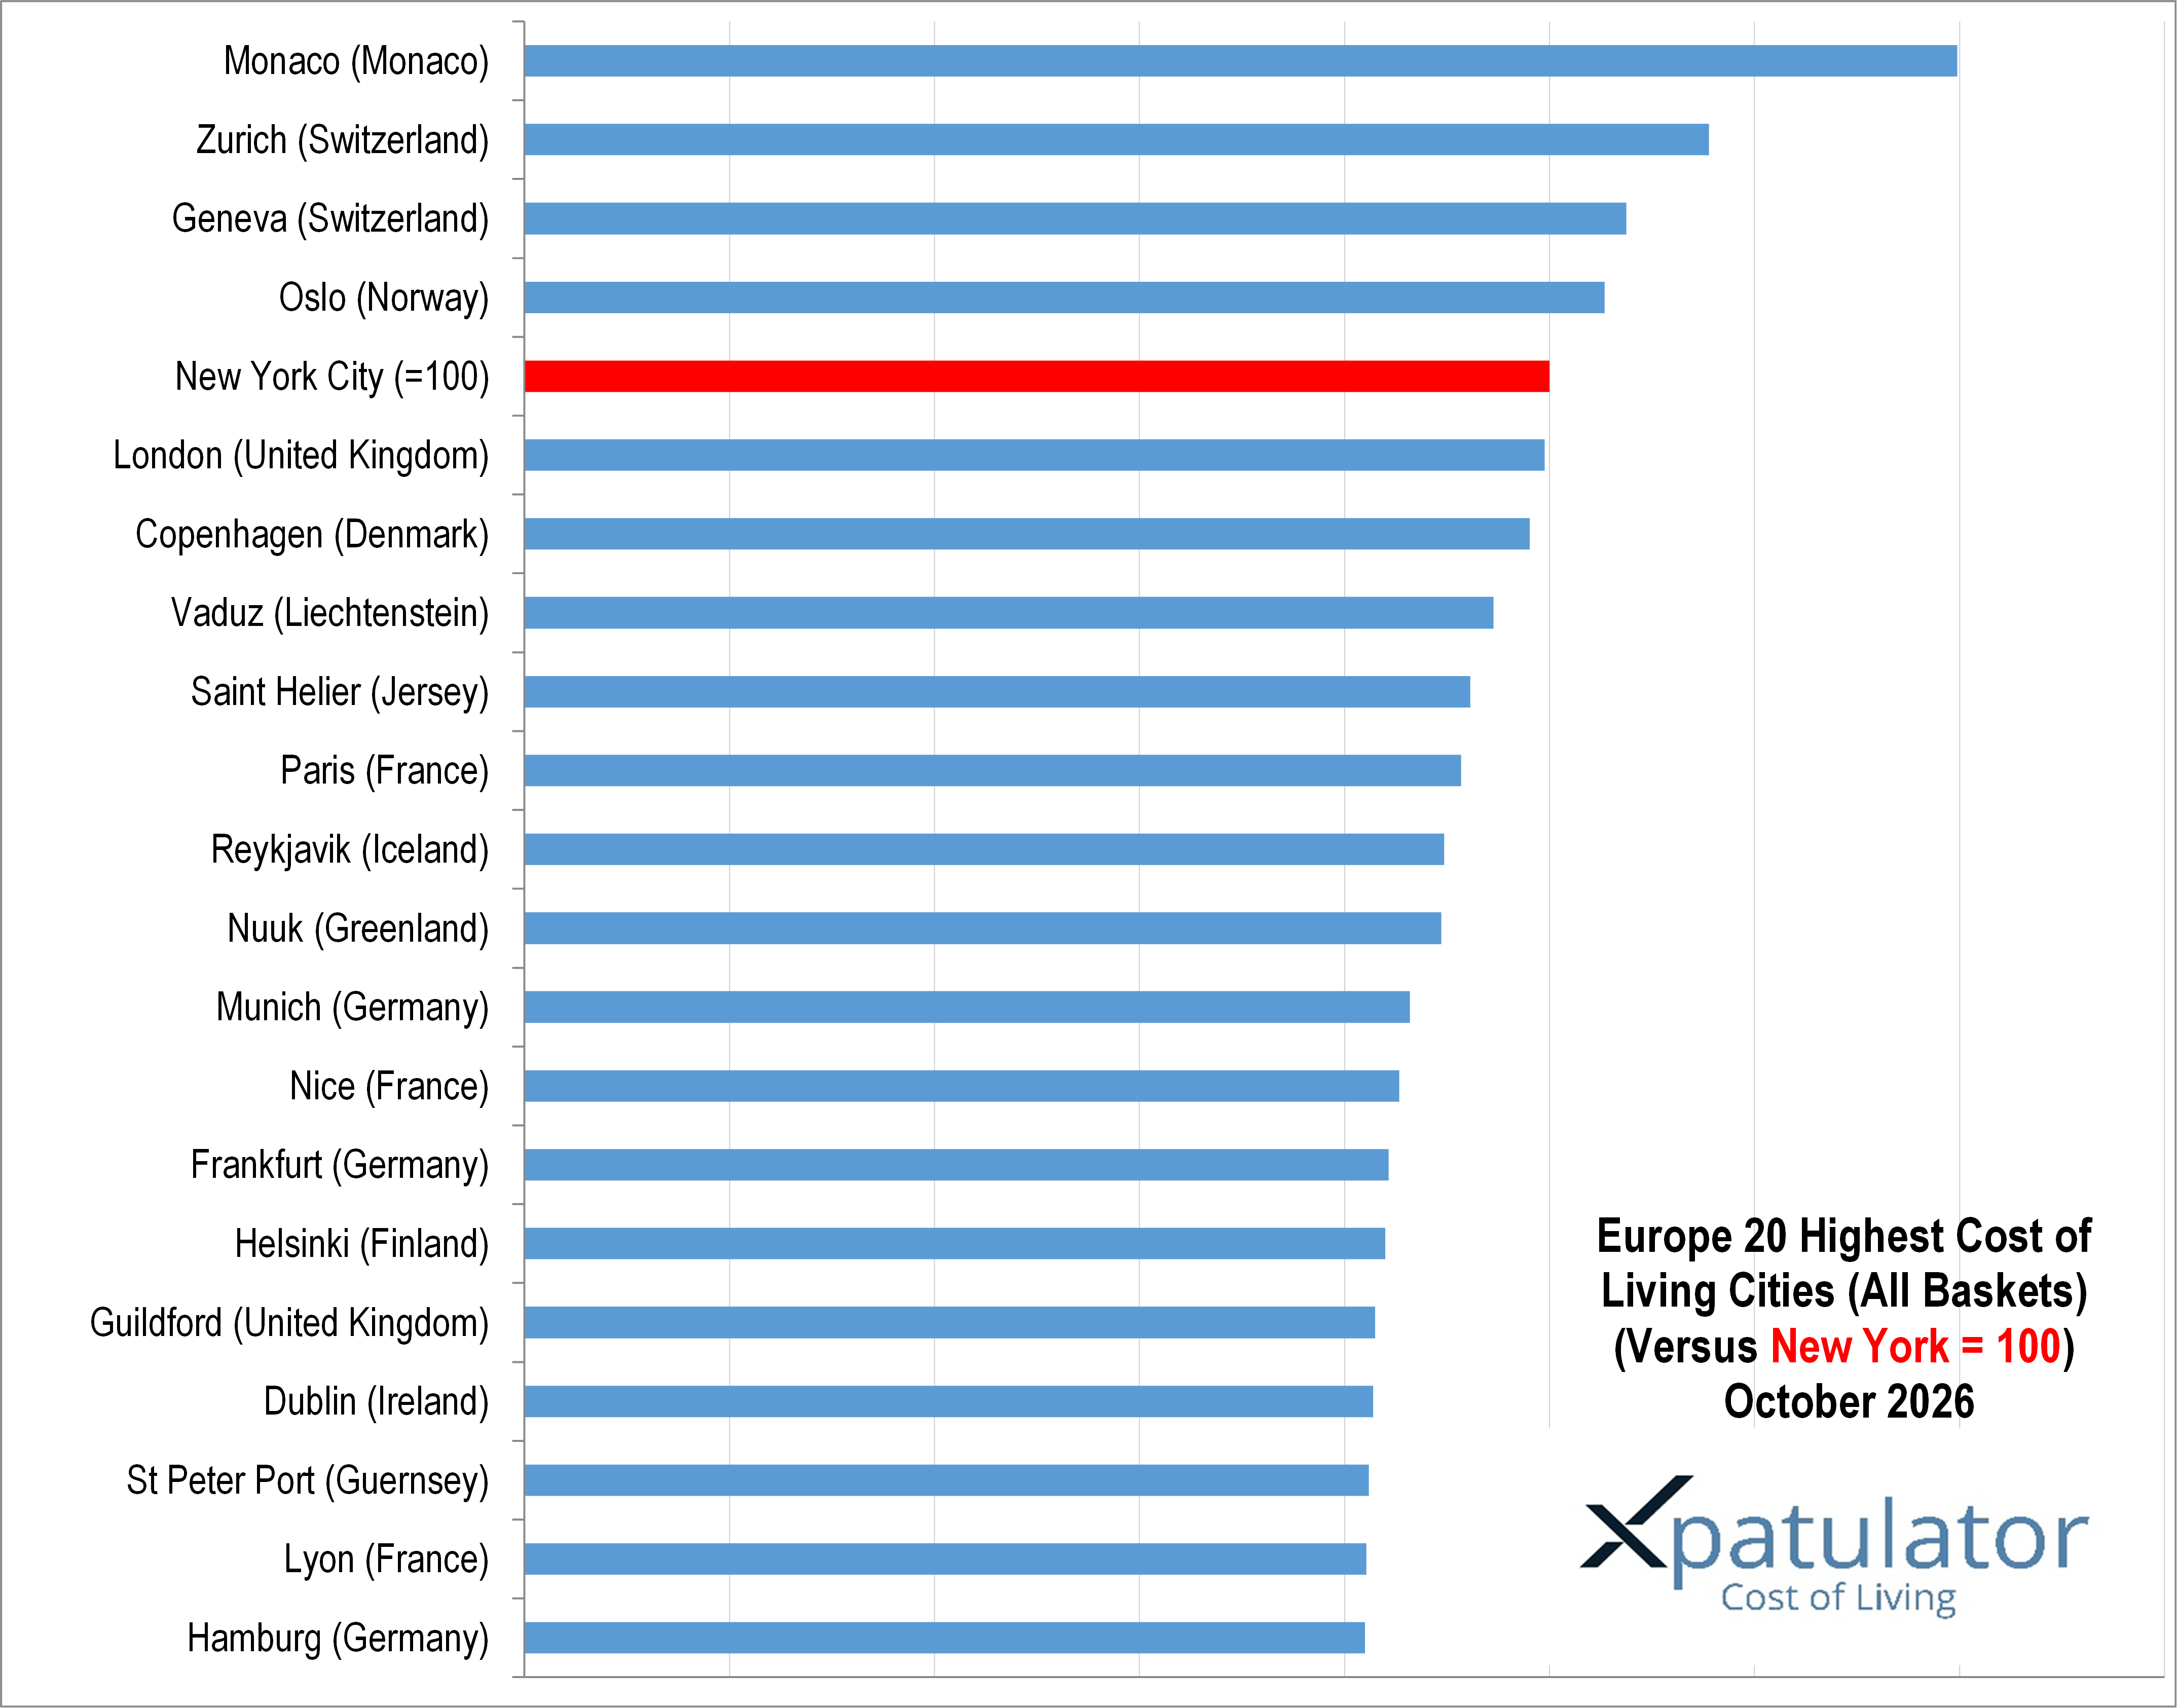
Xpatulator’s data as at 1 October shows Zurich’s Cost of Living Index falling from 118.4 in July to 115.5. Geneva declines from 110.3 to 107.5, Oslo from 108.2 to 105.4, Copenhagen from 100.5 to 98.1 and London from 101.4 to 99.5.

Bar chart showing the 20 highest cost of living cities in Europe compared to New York City, which is set as the baseline (100). Cities include Monaco, Zurich, Geneva, and others, with New York highlighted in red.

Yet euro area inflation increased to 3.8 per cent in September from 3.2 per cent in August, mainly because of higher energy and food prices. European households were therefore not generally experiencing falling prices.

The explanation lies partly in currencies. Cost of living comparisons between countries require local expenditure to be converted into a common basis. By late September, the United States dollar had reached a 16 month high against the euro and Swiss franc. Sterling was also near a three month low against the dollar.

For an expatriate earning United States dollars, a weaker European currency can therefore reduce the dollar cost of rent, transport and services. For a locally paid employee, however, the same currency weakness can increase the cost of imported fuel, food and other goods. The two employees can experience the same economy very differently.

Housing adds another complication. Zurich had only 252 vacant homes in June 2026, equivalent to 0.11 per cent of its housing stock. Geneva’s vacancy rate was 0.31 per cent. London’s average private rent reached 2,332 pounds sterling a month in August and was still increasing by 3.5 per cent a year.

This is why headline inflation does not provide a sufficient basis for deciding whether an international salary offer is competitive. Inflation measures changes in prices within an economy over time. A cost of living comparison asks a different question: how much does it cost to maintain a comparable standard of living between two locations?

Xpatulator addresses that question through 13 expenditure baskets weighted according to typical expatriate spending patterns. Accommodation carries the largest weighting at 30 per cent, making housing decisions particularly important for international assignments.

Dublin also demonstrates why rankings need care. The city rises 7 places to 17th between July and October, but its Cost of Living Index actually falls from 83.5 to 82.8. Its ranking improves because several competing European cities declined by more. A rising rank does not necessarily mean prices rose.

For anyone considering a move, the more useful question is therefore not whether the proposed salary is higher than the current one. It is whether the new salary will purchase an equivalent standard of living after housing, transport, groceries, healthcare, education and other relevant costs are taken into account. Xpatulator’s Salary Purchasing Power Parity Calculator provides a structured way to make that comparison.

Posted in Uncategorized | Tagged , , , , , , , , | Leave a comment

Why African Cities Can Be Expensive for Expatriates Even When Local Incomes Are Lower

Africa’s highest expatriate cost cities demonstrate why local income levels are a poor guide to the cost of an international assignment.

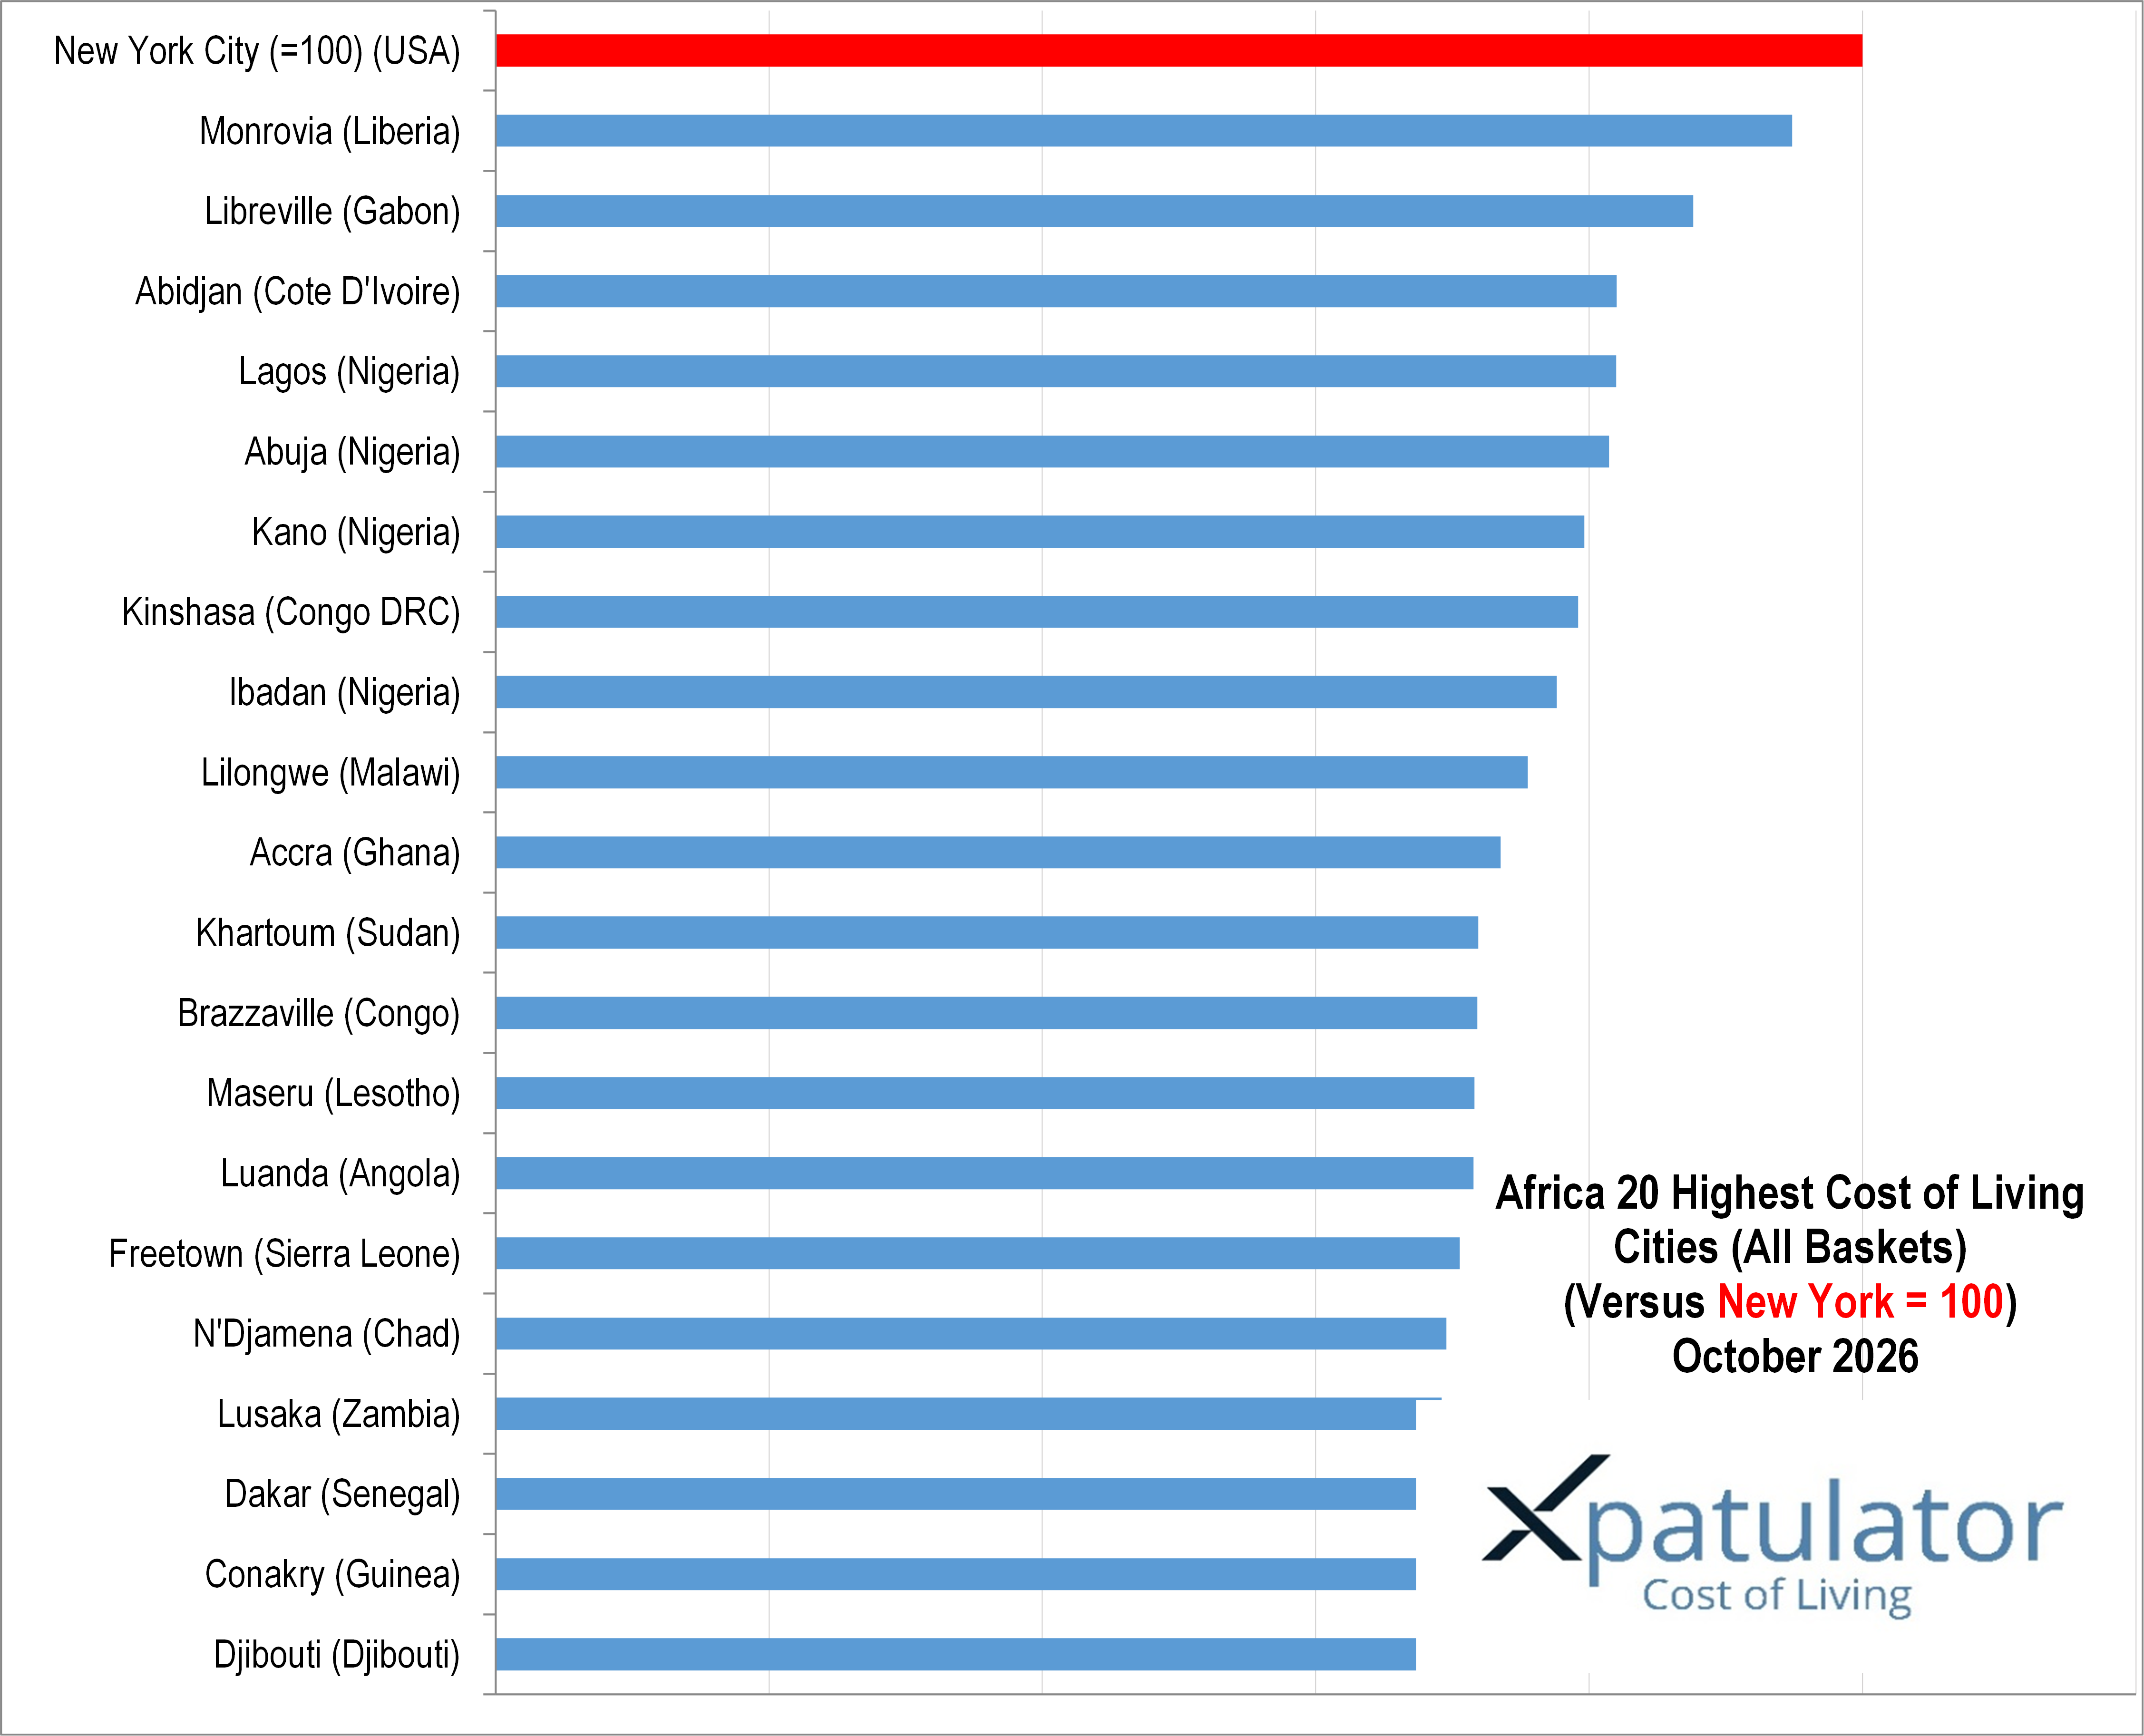
Xpatulator’s data as at 1 October 2026 places Monrovia 1st in Africa with a Cost of Living Index of 94.8. Libreville ranks 2nd, Abidjan 3rd, Lagos 4th and Abuja 5th. New York City is set at 100, meaning Monrovia’s expatriate basket is only moderately below the New York benchmark despite the very different income levels of the two economies.

The explanation lies in what an internationally mobile household buys. Expatriates often require secure accommodation, reliable utilities, private transport, healthcare, international education and imported groceries. These goods and services can exist within relatively small premium markets and may have little relationship to the prices paid by most local households.

Monrovia illustrates the point. Its transport basket is substantially above New York City, while international education and groceries are also relatively expensive. Liberia imports many goods and has limited foreign exchange buffers, although its currency has remained comparatively stable during 2026.

Bar chart comparing the cost of living in 20 cities across Africa to New York City, which is set as the baseline at 100, for October 2026.

Libreville and Abidjan demonstrate a different combination. Communication and groceries are expensive in both, while Abidjan also has relatively high education and transport costs. Their currencies are linked to the euro, which weakened by about 3 per cent against the United States dollar over the year to the end of September. This helps reduce their dollar converted costs, but does not eliminate the structural premiums associated with imported consumption and specialist services.

Nigeria presents another model. Lagos, Abuja, Kano and Ibadan all rank within Africa’s top eight. Private power, healthcare, transport and services contribute to the expatriate cost base. The naira has also strengthened against the United States dollar compared with a year earlier. At the same time, September brought another sharp increase in petrol and diesel prices, which affects almost every business and household through transport and electricity generation.

Inflation adds a further complication. Malawi’s inflation remained 20.0 per cent in August and Lilongwe’s ranking rises 4 places to 9th. Angola, by contrast, saw inflation decline to 8.78 per cent while Luanda’s ranking rises 10 places to 14th. These apparently contradictory movements are possible because national inflation measures price changes over time within one economy, while an international Cost of Living Index compares the cost of a particular basket across locations and exchange rates.

Conflict can make the distinction even greater. Khartoum remains 11th, but Sudan’s currency has depreciated severely and its economy remains fragmented by war. Some ordinary local prices may appear low when converted into foreign currency, while the cost of secure accommodation, healthcare, transport and reliable utilities required by an international organisation can remain substantial.

This is why an overseas salary should not be judged simply by converting it at the prevailing exchange rate. A better comparison asks what the employee currently buys at home and how much income is required to purchase an equivalent basket in the destination. Xpatulator’s methodology applies weighted expatriate expenditure baskets to that comparison, while its Salary Purchasing Power Parity Calculator estimates an equivalent host salary designed to maintain the same standard of living.

Posted in Uncategorized | Tagged , , , , , , , | Leave a comment

Why Monaco, Hong Kong and Singapore Remain the Most Expensive Country and State Locations

International cost of living rankings often combine very different types of economies. Xpatulator’s data as at 1 October 2026 illustrates this clearly.

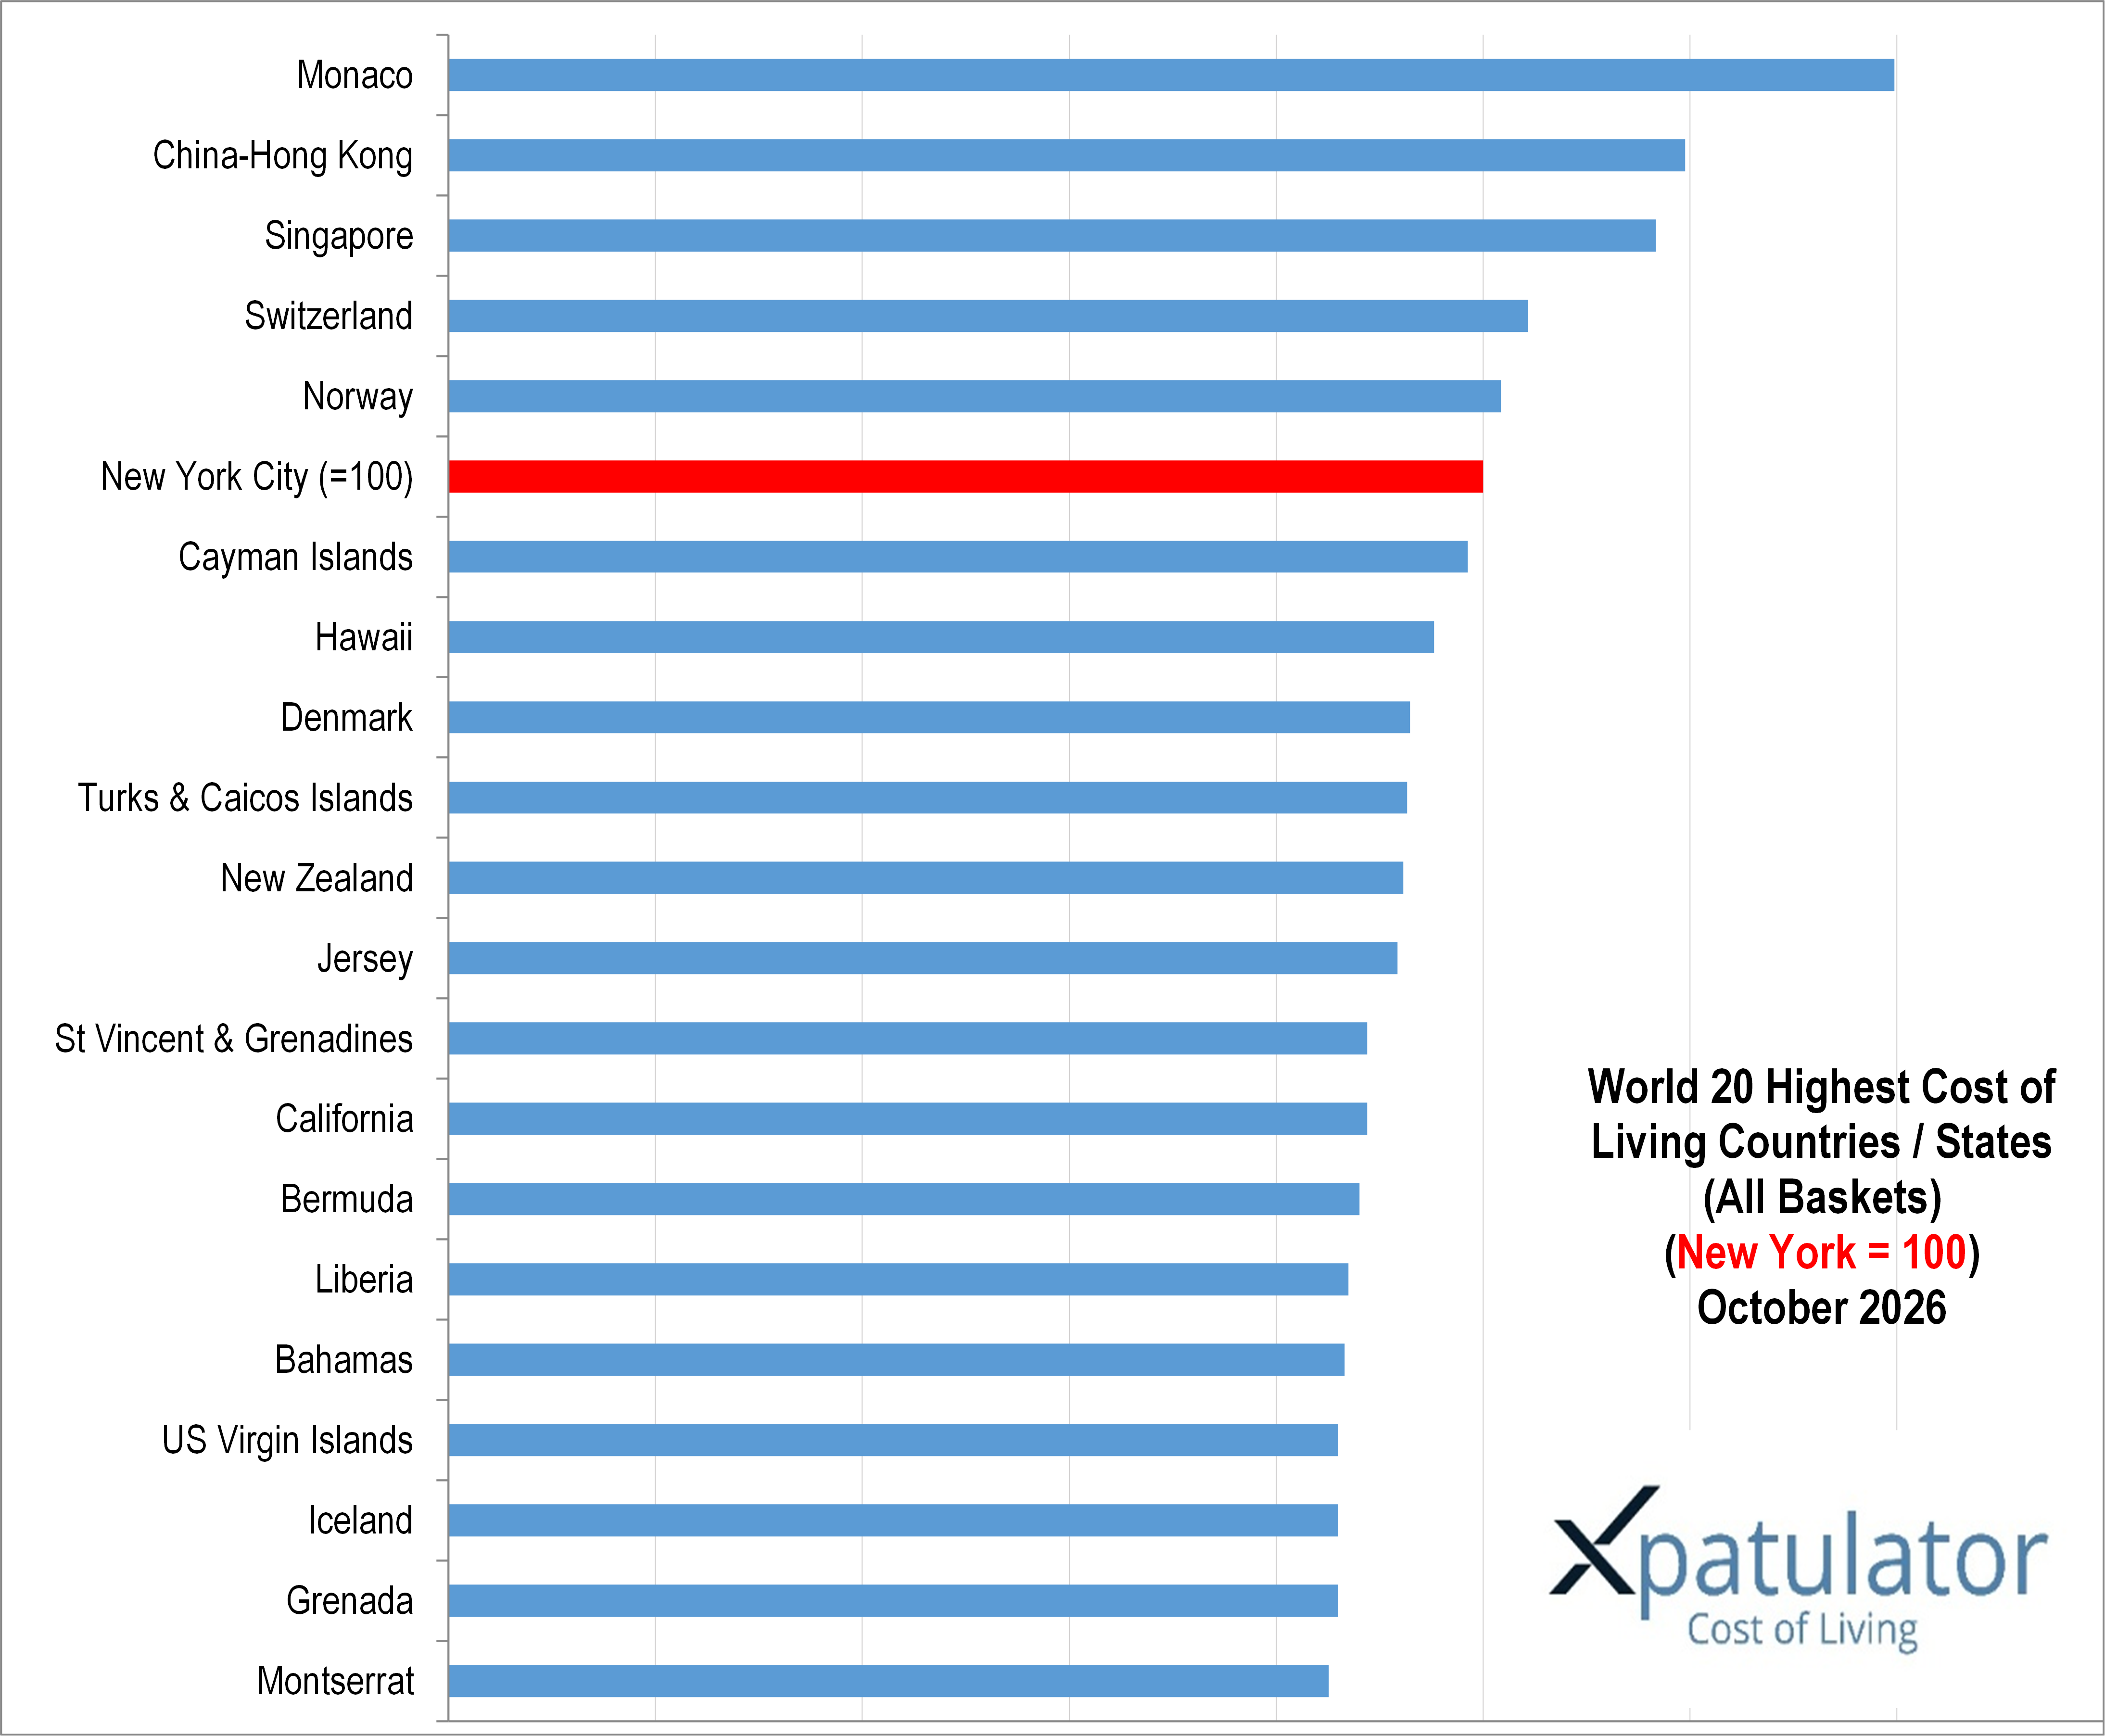
Monaco ranks 1st with a Cost of Living Index of 139.8. Hong Kong, China ranks 2nd at 119.5 and Singapore 3rd at 116.7. These locations share one important characteristic: limited space combined with strong international demand.

Bar chart displaying the 20 highest cost of living countries/states with New York City as the baseline (100) for October 2026.

Monaco’s constraint is particularly severe. Housing supply cannot expand easily, while demand comes from a wealthy international population. Hong Kong faces similar land constraints on a much larger scale, with accommodation accounting for a substantial part of the cost of maintaining an international professional lifestyle. Singapore also faces limited land, but its cost structure extends beyond housing into private transport, clothing, personal care and education.

Switzerland and Norway rank 4th and 5th for a different reason. Both have high wages and expensive domestic services. Transport and personal services therefore cost considerably more than in many other countries even where accommodation itself is not the dominant source of the premium.

Island locations create a third model. The Cayman Islands ranks 6th, Hawaii 7th and the Turks and Caicos Islands 9th. These economies face freight costs, dependence on imported goods and smaller retail markets. The result can be high grocery, communication and transport costs even when housing is less expensive than in Monaco or Hong Kong.

Exchange rates add another dimension. Hong Kong’s currency is linked to the United States dollar, so its international cost is relatively insulated from foreign exchange swings.

New Zealand, by contrast, has a floating currency. Its dollar weakened over the year to the end of September 2026, helping its ranking decline 3 places to 10th when costs are measured internationally.

Inflation adds further complexity. Singapore consumer inflation was 2.3 per cent in August, while import prices rose much faster because of higher energy costs. Xpatulator’s October international inflation analysis also points to renewed global energy and freight pressures associated with Middle East instability.

This explains why a cost of living ranking should not be treated as a simple inflation table. A location can move because its currency changes, because another location moves more quickly, or because the prices of heavily weighted expenditure categories change.

For an expatriate, the relevant question is therefore not whether the proposed overseas salary is numerically higher. The question is whether it buys at least the same standard of living after rent, transport, groceries, healthcare, education and other unavoidable costs have been paid. Xpatulator’s Salary Purchasing Power Parity Calculator provides a structured way to make that comparison.

Posted in Uncategorized | Tagged , , , , , , , , , , | Leave a comment

Why America’s Most Expensive Expatriate Locations Are Expensive for Different Reasons

A ranking of expensive places can hide important differences in what actually drives household costs. Xpatulator’s Americas data as at 1 July 2026 demonstrates this clearly. Manhattan, San Jose and San Francisco occupy the top three positions, but their cost profile differs from that of George Town, Hamilton and other Caribbean locations.

In major United States cities, the pressure largely reflects housing and the cost of professional services. New York’s rental shortage remained evident during the first half of 2026, while Manhattan rents reached record levels in June. In California’s major technology centres, healthcare, housing and transport can absorb a substantial proportion of an expatriate salary.

Caribbean cities operate under different constraints. Small populations limit economies of scale, while many groceries, vehicles and household products must be imported. Freight and distribution therefore become part of the everyday cost base. Several currencies are also linked to the United States dollar, reducing exchange rate fluctuations but leaving households exposed to local inflation and import prices.

The distinction matters when assessing a job offer. An expatriate moving from a cheaper location may receive a substantially higher nominal salary and still have less disposable income after accommodation, schooling, healthcare and transport. Cost of living comparisons are therefore most useful when they replicate the household’s actual spending pattern rather than relying on a single generic consumer price measure.

Xpatulator uses thirteen weighted expenditure baskets based on expatriate spending norms and compares equivalent quantities of goods and services between locations. Its Salary Purchasing Power Parity Calculator can then estimate the host salary required to provide purchasing power comparable with the employee’s current location.

For anyone considering an international move, the more useful question is not how much the new job pays, but what remains after the unavoidable costs of living in the destination have been paid.

Posted in Uncategorized | Tagged , , , , , , , , , , , , | Leave a comment

Europe Cost of Living 2026: What International Assignees Should Know

Europe contains some of the world’s most expensive expatriate locations. Xpatulator’s data as at 1 July 2026 shows Monaco, Zurich, Geneva, Oslo, London and Copenhagen all above the New York City benchmark.

The ranking uses New York City as the base location, with an index of 100. Monaco ranks first in Europe and globally at 140.8. Zurich ranks second in Europe at 118.4, followed by Geneva at 110.3, Oslo at 108.2, London at 101.4 and Copenhagen at 100.5.

These cities are expensive for different reasons. Monaco is shaped by scarce land, high property values and strong international demand. Zurich and Geneva reflect high wages, high service costs, expensive healthcare and the Swiss franc. Oslo and Copenhagen reflect the cost structure of Nordic high income economies, where services, transport, childcare and restaurants can be expensive.

London remains above the New York City benchmark because of housing, private rents, transport, childcare and the cost of paid services. United Kingdom national averages are not enough for London assignments because neighbourhood, commute and school choice can change the budget significantly.

Paris, Nice, Lyon and Marseille show that costs in France differ materially by city. Paris remains expensive because of housing and central services, while Nice and Marseille reflect Mediterranean demand and lifestyle related costs. Munich, Frankfurt, Hamburg and Berlin show similar city level variation in Germany.

Vaduz, Saint Helier and St Peter Port are smaller markets where limited housing supply and imported goods can create high expatriate costs. Reykjavik and Nuuk show the cost of distance, freight, limited retail competition and small housing markets.

Inflation and exchange rates remain important. A stronger euro, Swiss franc, pound sterling or Nordic currency against the United States dollar can raise the converted cost of living. Energy related inflation can also affect utilities, transport and logistics, which then influence the expatriate basket.

The main lesson for expatriates is that salary offers should not be assessed using gross salary alone. Rent, healthcare, education, transport, utilities, groceries and personal services can absorb very different shares of income depending on the host city.

For employers, cost of living data supports fairer and more consistent assignment packages. It helps identify whether housing support, schooling support, transport support or a cost of living allowance is needed.

Xpatulator’s Salary Purchasing Power Parity Calculator helps compare home and host locations and estimate the salary required to maintain a comparable standard of living.

Use Xpatulator’s Cost of Living Calculators and Tools to support better decisions on European relocation, salary purchasing power and international assignment packages.

Posted in Uncategorized | Tagged , , , , , , , , , , , , | Leave a comment

Asia Pacific Cost of Living 2026: What International Assignees Should Know

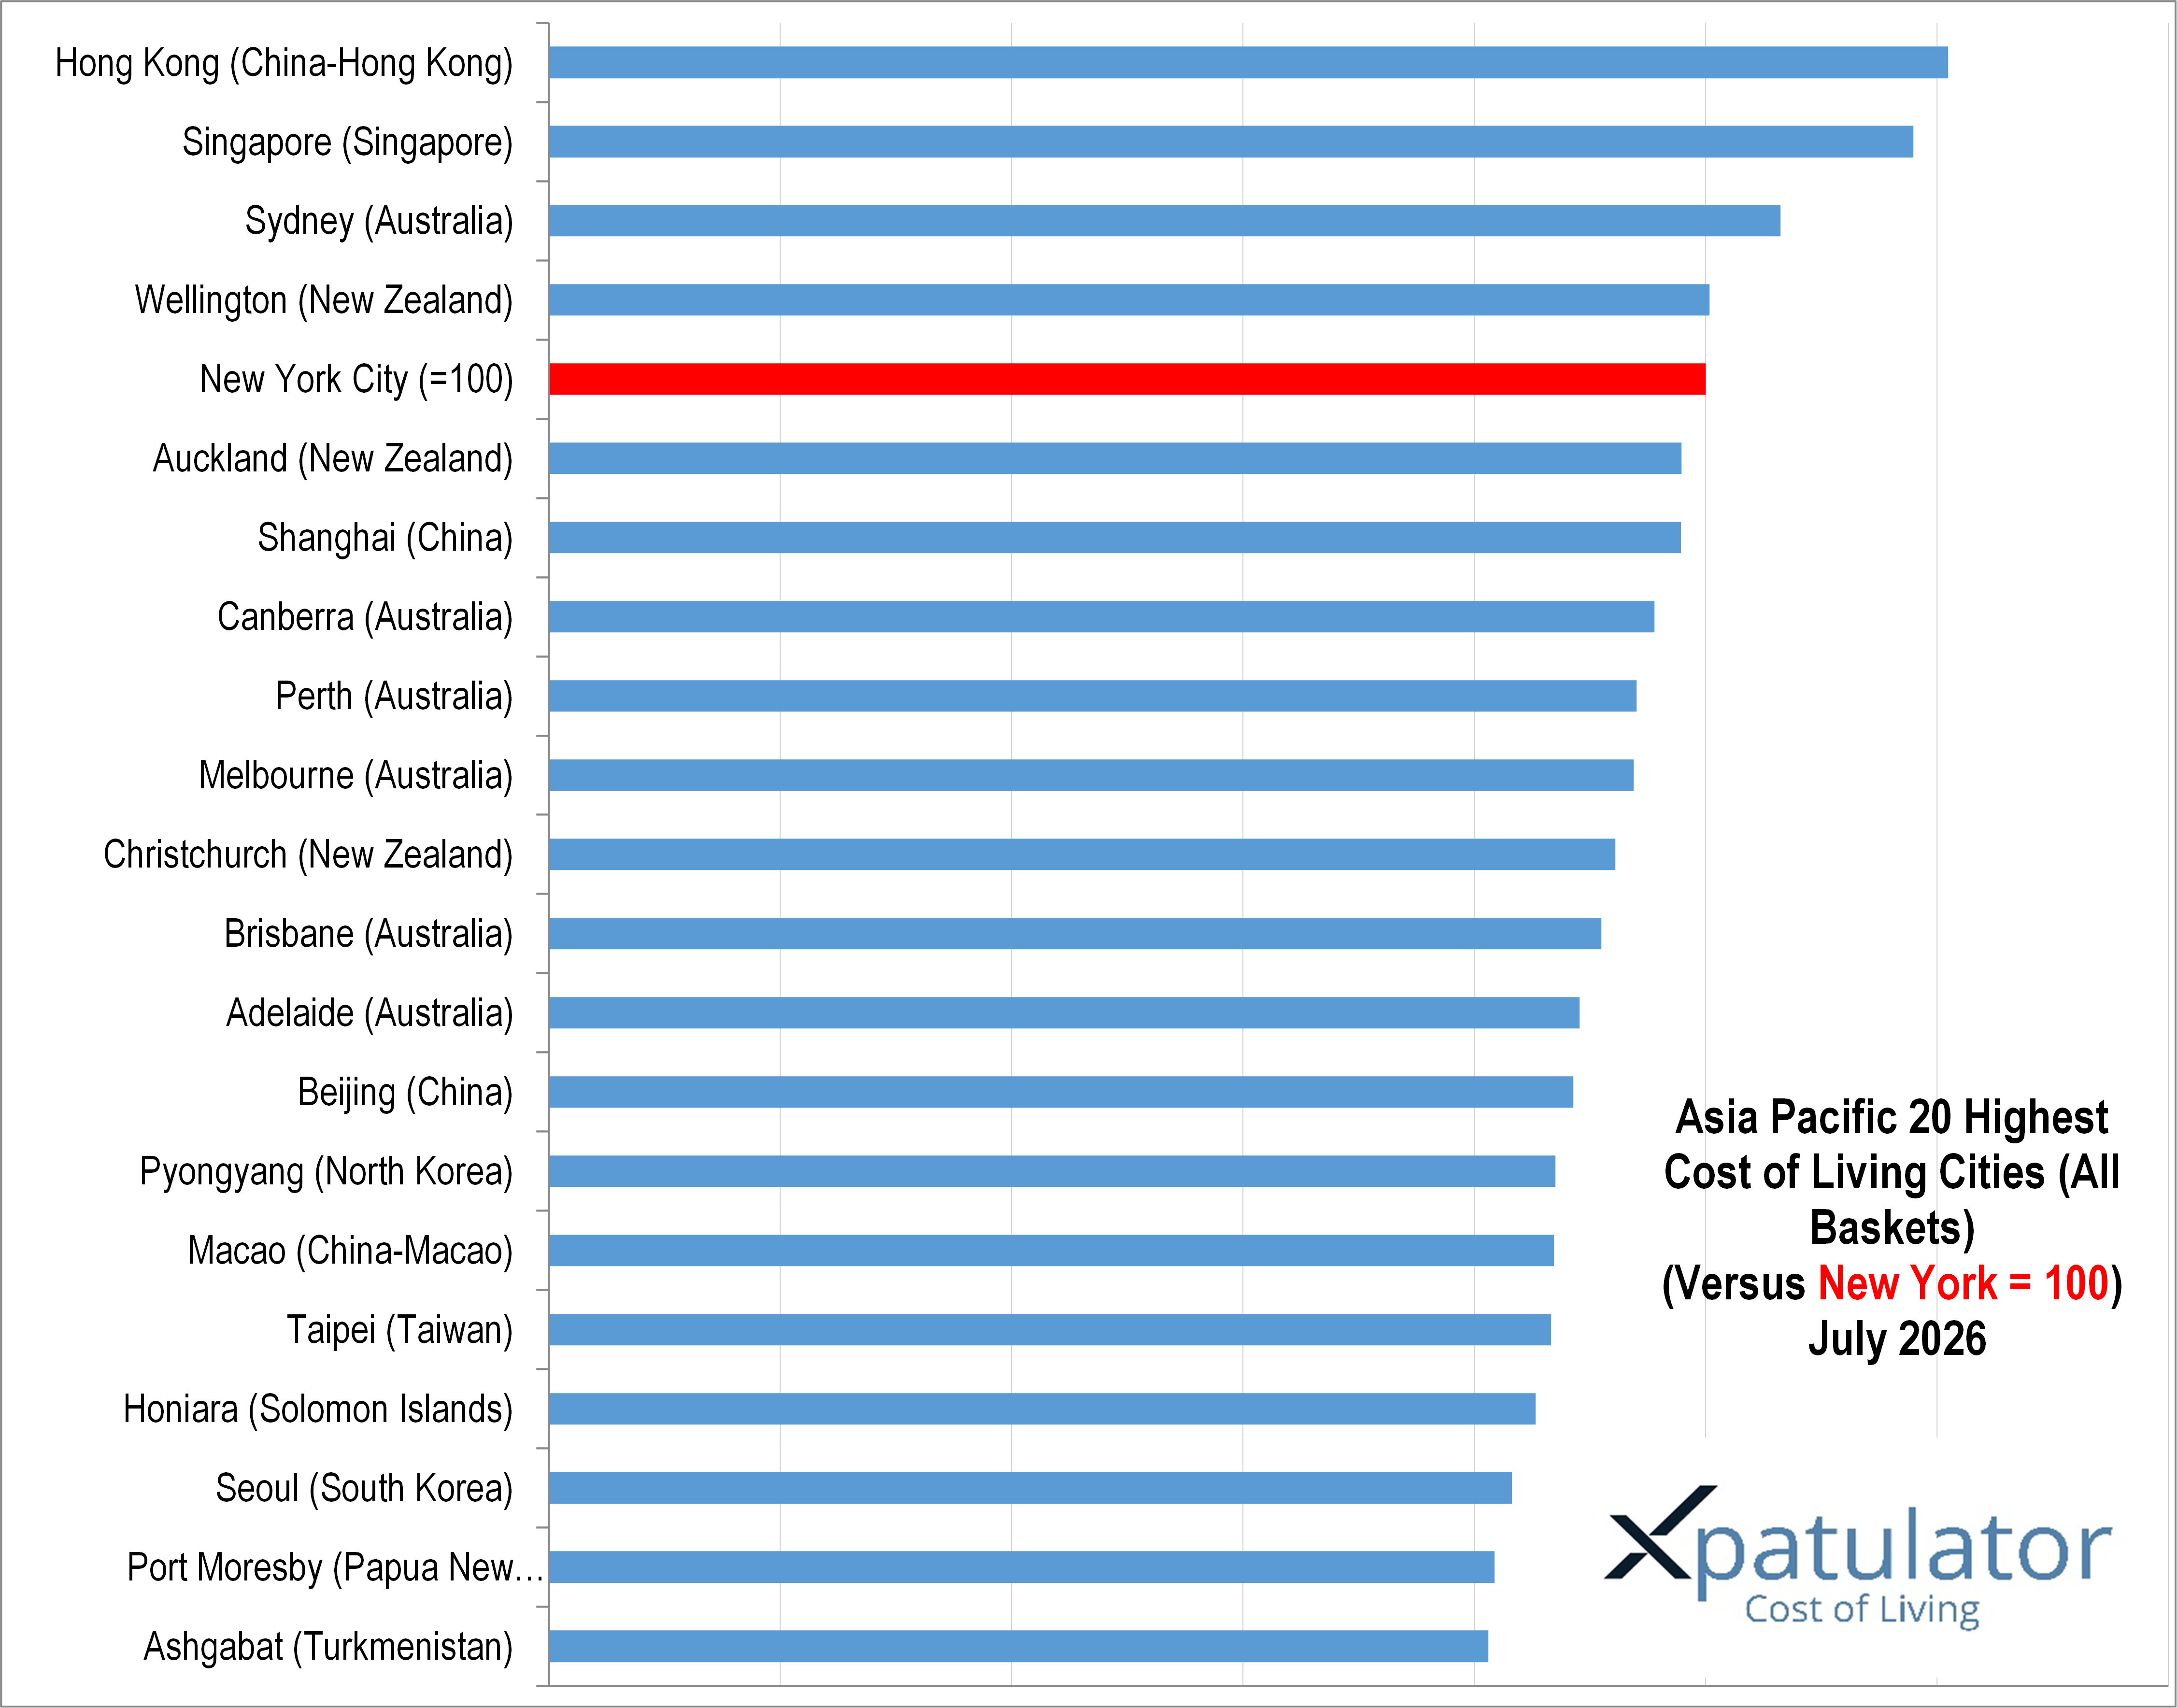
Asia Pacific remains one of the most varied regions for expatriate cost of living. Xpatulator’s data as at 1 July 2026 shows that Hong Kong, China, Singapore and Sydney are the highest cost regional cities, but the reasons differ by location.

Hong Kong, China ranks first in Asia Pacific with a cost of living index of 120.9. The main driver is accommodation. Limited land, dense development and renewed expatriate rental demand keep housing costs high. International schooling, private healthcare and imported goods can add further pressure.

Singapore ranks second in the region at 117.9. It is efficient, safe and well connected, but expatriate living costs are influenced by housing, education, transport, healthcare, groceries and paid services. For many families, the difference between an adequate package and a weak package is whether housing and schooling are properly included.

Sydney ranks third at 106.4. Housing, transport, childcare, services and imported goods make the city expensive for expatriates. Other Australian cities may be lower, but they still require careful analysis because housing area, commuting patterns and schooling choices can materially change the monthly budget.

Bar chart depicting the cost of living in 20 cities in the Asia Pacific region compared to New York City, which is set as the baseline at 100, for July 2026.

Wellington and Auckland remain high by regional standards because New Zealand is a smaller and more remote market. Distance, freight costs, housing pressure, utilities and imported goods can all affect the expatriate basket. A weaker currency may reduce some converted costs, but it can also increase the local price of imported items.

Shanghai, Beijing, Macao, Taipei and Seoul each show a different cost pattern. The headline index can be lower than Hong Kong, China or Singapore, but expatriate costs rise quickly where the household requires premium housing, private healthcare, imported groceries and international schooling.

Honiara, Hagatna and Port Moresby illustrate the cost of distance and limited supply. Secure housing, private transport, reliable utilities and imported goods may matter more than ordinary local consumer prices.

The main lesson for expatriates is that salary offers should not be assessed using gross salary alone. Rent, healthcare, education, transport, groceries, utilities and personal services can absorb very different shares of income depending on the host city.

Exchange rates and inflation add another layer. If the home salary currency weakens against the host spending currency, purchasing power can fall even when the salary has not changed. If imported goods rise in price, the expatriate basket may become more expensive even when national inflation appears moderate.

For employers, cost of living data helps create fairer and more consistent assignment packages. It helps identify whether housing support, schooling support, transport support or a cost of living allowance is needed.

Xpatulator’s Salary Purchasing Power Parity Calculator helps compare home and host locations and estimate the salary required to maintain a comparable standard of living.

Use Xpatulator’s Cost of Living Calculators and Tools to support better decisions on Asia Pacific relocation, salary purchasing power and international assignment packages.

Posted in Uncategorized | Tagged , , , , , , , , , , | Leave a comment

Africa Cost of Living 2026: What International Assignees Should Know

Africa contains some of the most varied expatriate cost of living conditions in the world. Xpatulator’s data as at 1 July 2026 shows that the highest cost African cities are not always the largest or most developed. In many cases, cost is driven by scarcity, import dependence, logistics, currency pressure and the need for reliable private services.

The highest ranked African city in the Xpatulator data is Monrovia, with a weighted cost of living index of 94.8. Libreville follows at 88.6, then Abidjan at 83.9, Lagos at 81.4, Abuja at 80.9 and Kinshasa at 79.9. Kano, Ibadan, Accra and Brazzaville complete the African top ten.

These rankings are important because expatriate costs often differ from ordinary local living costs. International professionals may require secure accommodation, dependable power and water, private healthcare, international schooling, imported groceries, private transport and suitable communications. Where these goods and services are scarce, they can be expensive even in lower income economies.

Monrovia illustrates the point. The local economy may be lower cost for many domestic households, but expatriates usually require a narrower and more expensive basket of secure housing, imported goods and reliable services. Libreville and Malabo show a similar pattern in smaller resource linked economies, where the premium housing and services market is limited.

Abidjan, Lagos, Abuja, Accra and Dakar are larger commercial centres, but they still require careful package planning. Housing, transport, schools, healthcare and imported goods can materially reduce salary purchasing power. Fuel prices also matter because fuel affects transport, logistics, generator use and the price of goods.

Kinshasa and Brazzaville are shaped by logistics, infrastructure and the availability of secure, reliable services. Lilongwe, Freetown and Conakry show how import dependence and foreign exchange constraints can affect expatriate costs. Khartoum, Mogadishu and other higher risk locations require additional caution because security, access and contingency arrangements may matter as much as ordinary prices.

South African cities such as Cape Town, Johannesburg, Pretoria, Gqeberha, Durban and Bloemfontein sit lower in the African ranking, but expatriate costs still depend on housing area, schooling, healthcare, transport and lifestyle assumptions. The same applies to Nairobi, Maputo, Addis Ababa, Kigali, Kampala, Windhoek, Port Louis, Cairo and Tunis.

Inflation and exchange rates remain central. Many African countries import fuel, food, vehicles, medicines and manufactured goods. When local currencies weaken against the United States dollar, imported items can become more expensive. When fuel prices rise, transport and logistics costs can flow through to groceries, services and household goods.

For expatriates, the lesson is straightforward. Do not compare job offers using gross salary alone. Compare what the salary will buy after local rent, utilities, healthcare, education, transport, groceries and personal services are included.

For employers, a structured cost of living comparison supports fairer and more consistent mobility packages. It helps identify whether housing support, schooling support, hardship provisions or a cost of living allowance is needed.

Xpatulator’s Salary Purchasing Power Parity Calculator helps estimate the salary required to maintain living standards when moving between locations.

Xpatulator’s Cost of Living Index report calculator produces index values for multiple host locations relative to a chosen home base of 100. It outlines why a global mobility specialist would use a multi location index report to support location comparisons, policy decisions and early stage budgeting, and it emphasises the practical importance of basket selection and cost allocations so the index reflects costs that employees actually pay from salary. It concludes with a clear step by step guide to running and saving the report. 

Use Xpatulator’s Cost of Living Calculators and Tools to compare African locations and make informed decisions on salary, allowances and assignment packages.

Posted in Uncategorized | Tagged , , , , , , , , , , , , | Leave a comment