
 Brazil – Sao Paulo and Rio de Janeiro come in fifth and ninth respectively as two of the overall most expensive places to live in the world, with Caracas, Venezuela coming in sixth.
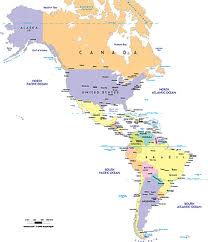
Of the top 50 most expensive destinations to live based on the overall cost of living, the Americas have 8 locations listed.
The latest international cost of living rankings are based on data collected during the past 3 months for 780 international locations, covering every country world-wide.
The cost of living (COL) data collected is representative of an expatriate lifestyle. The components of the COL data are local prices for fixed quantities of the same goods and services in each location, local inflation and exchange rates. Prices in each location are affected by availability (i.e. supply & demand) as well as local pricing regulations and taxes on goods and services (e.g.premiums on luxury brands). Local inflation is usually representative of local price increases which in turn impacts an expatriates purchasing power in the host country. The exchange rate impacts both the price of imports to the host country and the expatriate assignment salary calculation between the home and host country. The cost of living has a significant impact on the purchasing power of an expatriate’s salary package.
The top 20 Most expensive places to live in the Americas – Overall Cost of Living & All Baskets:
- Venezuela, Caracas
- Brazil, Sao Paulo
- Venezuela, All Areas
- Brazil, Rio de Janeiro
- USA, New York (Manhattan) NY
- USA, New York (Brooklyn) NY
- Brazil, Brasilia
- USA, Honolulu HI
- Canada, Toronto
- USA, New York (Queens) NY
- USA, San Jose CA
- USA, San Francisco CA
- Canada, Vancouver
- Canada, Edmonton
- Netherlands Antilles, All Areas
- Aruba, All Areas
- Canada, Calgary
- USA, New York NY
- Bahamas, Nassau
- Montserrat, All Areas
About Xpatulator.com’s Cost of Living Data
Xpatulator.com’s cost of living data is based on prices for the same quantity and quality of goods and services, representative of expatriate lifestyle, in each city. The data is collected and updated on a quarterly basis. The cost of living data is used by Xpatulator.com clients to calculate salary purchasing power parity, cost of living allowances, and customized (i.e. clients can select their own base city) cost of living indexes for expatriate assignments online, using Xpatulator.com’s 3 premium content calculators.
The 13 basket groups do not count equally and are weighted according to expatriate expenditure norms as follows (weighting percentage is in brackets):
1. Alcohol & Tobacco (2%): Alcoholic beverages and tobacco products.
2. Clothing (2.5%): Clothing and footwear products.
3. Communication (2%): Telephone, Internet, Mobile Contract and Calls.
4. Education (5%): Creche Fees, School Fees, College Fees, and Tertiary Study Fees.
5. Furniture & Appliances (5%): Furniture, household equipment and appliances.
6. Groceries (16.5%): Food, non-alcoholic beverages and cleaning materials.
7. Healthcare (5%): Doctor Consultation rates, Private Ward Rate, Prescription Medicine, and Private Medical Insurance Contributions.
8. Household (30%): Housing rental, utilities, local rates and residential taxes.
9. Miscellaneous (3%): Stationary, Linen and general goods and services.
10. Personal Care (3%): Personal Care products and services.
11. Recreation & Culture (6%): Books, Camera Film, Cinema Ticket, DVD and CD’s, Sports goods, Theatre Tickets.
12. Restaurants Meals Out and Hotels (2%): Dinner at Restaurant (non fast food), Hotel Rates, Take Away, Drinks & Snacks (fast Food).
13. Transport (18%): Public Transport, Vehicle Costs, Vehicle Fuel, Vehicle Insurance and Vehicle Maintenance.

