Dubai


We have taken Dubai as our location to equate the cost of living to the rest of the world. Each emirate in the UAE have slightly different practices. Most companies provide, reimburse or provide an allowance, for benefits such as Healthcare, Housing, Schooling etc. These benefits are usually determined by your job and family status and varies by company and sector. When using the calculator, you need to select which of the basket groups is applicable to your circumstances and this will determine the equitable salary.

Dubai has an overall High Cost of Living. The overall cost of living index is comprised of the prices for defined quantities of the same goods and services across all 13 Basket Groups. Dubai is currently ranked 7 overall, most expensive place in the world for expatriates to live, out of 276 international http://www.xpatulator.com locations. The exact customised cost of living index for Dubai is based on the Basket Groups that you select in the Calculators.
In terms of the relative hardship people are likely to experience, assessed in global terms, Dubai is ranked as a minimal hardship location. The exact customised hardship index premium for Dubai is based on the comparison location that you select in the Calculators.

I will equate, a few more Middle East countries tomorrow…..

Posted in Cost of living in Dubai | 1 Comment

Moving to The United Arab Emirates

I have had a lot of clients looking at moving to The Middle East, in my first blog on a country, I will focus specifically on The UAE.

It is a union of seven small Arab emirates.

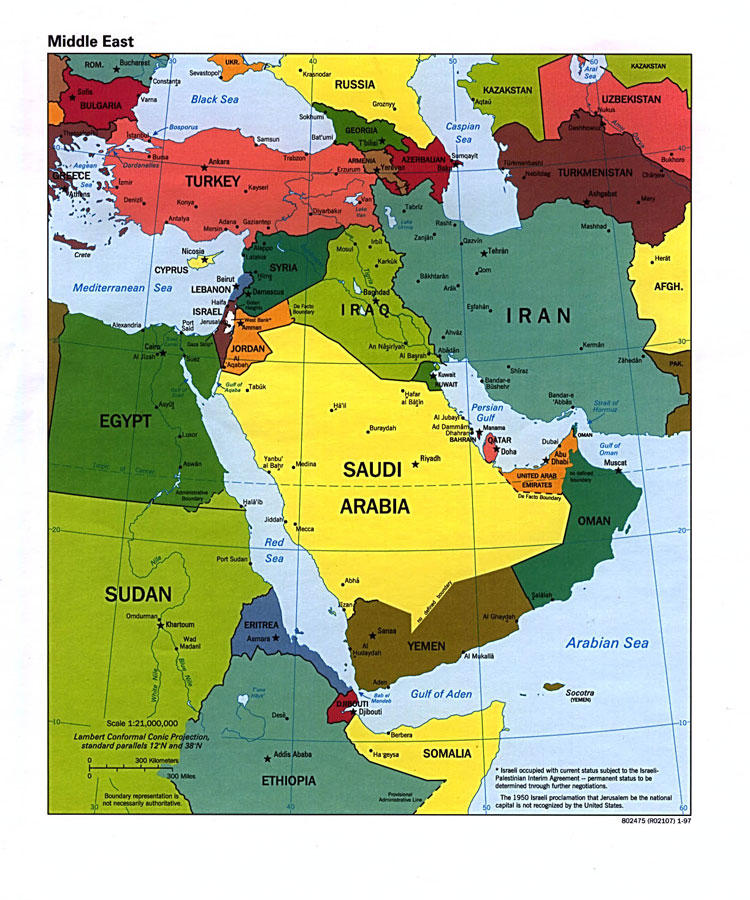
LOCATION: The United Arab Emirates is in the Middle East, bordering the Gulf of Oman and the Persian Gulf, between Oman and Saudi Arabia.

CAPITAL CITY: Abu Dhabi

LARGEST CITY: Abu Dhabi

CURRENCY: UAE Dirham (AED)

ECONOMY: The United Arab Emirates has a highly industrialized economy. Although the UAE is becoming less dependent on natural resources as a source of revenue, petroleum and natural gas exports still play an important role in the economy. A massive construction boom, an expanding manufacturing base, and a thriving services sector are helping the UAE diversify its economy. There is currently approximately $350 billion worth of active construction projects. Although Dubai’s economy was built on the back of the oil industry, revenues from oil and natural gas currently account for less than 6% of the UAE’s revenues. The government’s decision to diversify from a trade-based, but oil-reliant, economy to one that is service and tourism-oriented has made real estate more valuable, resulting in extreme property appreciation. Large scale real estate development projects have led to the construction of some of the tallest skyscrapers and largest projects in the world such as the Emirates Towers, the Palm Islands and the world’s tallest, and most expensive, hotel the Burj Dubai.

Climate
From October to April (Winter) – moderate temperatures averaging 20 degrees.
The temperature peaks in Summer (May to September) up to 49 degrees.
Sandstorms and dustorms are common, while the eastern highlands are generally cooler and rainier.

HISTORY
The emirates had its beginnings in the 18th Century. The economy relied on pearl fishing and trading. In the 1820s, Britain forced the states to sign a series of treaties due to the conflict between ruling leaders and piracy along the coast. They took control of foreign affairs. In 1958, oil was discovered and in 1962 the first exports began. In 1952, the emirates set up a Trucial Council to increase cooperation between the various states and in 1968 Britain announced the withdrawal of its forces.

POLITICS
in 1971, he country became independent, when 6 of the 7 states agreed to form a single country – the United Arab Emirates. In 1972 the last state joined the emirates.
The emirates consist of the following states – Abu Zaby (Abu Dhabi), Ajman, Dubayy (Dubai), Al Fujayrah, Ash Shariqah (Sharjah), Umm-al-Qaywayn and Ras al Khaymah.
Each Emirate has its own Emir who controls internal affairs.
The federal government controls foreign affairs and defence and plays a leading role in the social and economic development of the country.
The 7 Emirs form a Federal Supreme Council, it elects the federation’s president and vice president who serve for five years.
The President appoints the Prime-Minister. The country is one of the most liberal and tolerant of the Persian Gulf countries, but is the only one without elected bodies.
It is the 6th largest oil exporter in the world.

Tomorrow I will discuss the Cost of living in the emirates in more detail….

Posted in The 7 Emirates | Comments Off on Moving to The United Arab Emirates

Being an Expat

Moving around the world has its ups and downs and we must be honest you never really quite know what you are letting yourself into. It takes at least 6 months to settle down into a kind of routine, then you need to learn the rules of the road, country and people (unless of course they are similar to yours), where are the best shops, restaurants, beaches or entertainment, places of interest, etc etc. Even after exploring, researching and talking to other expats and locals , you can still unfortunately get this horribly wrong.

6 months to a year down the road, and you are an expat local, you know where YOU like to go, what YOU like to do and how YOU like to relax. The city is now yours, but getting there takes time and it is this time that we need to give ourselves to settle. Unless you are a nomad or a gypsy, getting used to being an expat can be trying at best.

I would like to try and make this a blog where you can express yourself as an expat, how have you coped, what insight can you give to others on your experiences, how can you help people moving to your part of the world to settle? Do you have something to help people, let them know…….help is all that is needed.

Posted in Uncategorized | Comments Off on Being an Expat

Expatriate Cost of Living India

When an expatriate moves from one geographic location to another, the change in cost of living they experience is relative to the change in the purchasing power of their salary. The basic principle is that a move to a higher cost of living city should be accompanied by a proportionately higher salary in order to maintain the same amount of purchasing power and vice versa.  If an expatriate is fortunate enough to move to a lower cost of living city without a decrease in their salary, their purchasing power increases proportionately to the decrease in the cost of living.

India still offers opportunity for expatriates moving to India to experience an increase in their purchasing power. The major cities of India offer a relatively low cost of living for expatriates.  Bangalore has an overall cost of living index (comprised of the prices for defined quantities of the same goods and services) of 64.6 (New York=100) and is the 38th cheapest place in the world for expatriates to live, out of our 276 international locations. In comparison Hyderabad has an index of 68.8 and is ranked 55th, Calcutta has an index of 69.3, and is ranked 56th, Chennai has an index of 70.7 and is ranked 65th,New Delhi has an index of 71.4 and is ranked 70th, while Mumbai has an index of 76 and ranked the 105th cheapest place in the world for expatriates to live.

Cost of living is however only half the story.  In determining how much to pay an expatriate the relative hardship they are likely to experience must also be taken into consideration.  An expatriate moving to a country with little hardship is unlikely to need much incentive. However in order to encourage an expatriate to move to a relatively high hardship country, compared to what they are used to, requires an incentive in the form of compensation for the hardship they are likely to experience. Hardship is one of the main differentiators between expatriate salary levels and local salary market levels.  As a rule of thumb an expatriate will always cost an employer more than a local hire.

In terms of the relative hardship expatriates are likely to experience moving to India, assessed in global terms, India is currently ranked as an extreme hardship location, which typically commands a 40% salary premium for hardship. Hardship is relative however; in the same way that cost of living is relative.  An expatriate moving from a country similar to India would experience less hardship than someone moving from a country that is completely different.

The global factors which are used to determine a relative hardship ranking world-wide include differences in:

·         Economic conditions such as poverty and service provision.

·         Political conditions such as tolerance of diverse views, life style and conformity to cultural norms.

·         Religious conditions such as religious prevalence, and tolerance of other religions.

·         Public Service conditions such as provision, administration and accessibility to water, electricity, sanitation, work permits etc.

·         Climatic conditions such as extremely hot or cold weather.

·         Safety conditions such as personal security and the threat of public violence.

·         Health conditions such as health standards and risk of viral outbreaks.

·         Education conditions such as state education standards, expenses, mother-tongue teaching, and school proximity to home.

·         Transportation conditions such as public transport availability, safety and efficiency.

Expatriate Salary Calculation

So what do cost of living and hardship differences mean in practical terms? Let’s consider an expatriate moving from New York to Bangalore.  In terms of hardship they would qualify for a 30% hardship allowance (40% for Bangalore less 10% for New York). The overall cost of living in Bangalore is 35.4% cheaper than New York given the Bangalore cost of living index of 64.6 versus New York’s 100.  A salary of $100,000 in New York adjusted for the negative difference in cost of living and the positive hardship premium would equate to 4,086,450 (INR).

Salary in New York X Cost of living difference X Hardship Premium X Exchange Rate = Salary in India

$100,000 X 0.646 X 1.30 X 48.6598 = 4,086,450 (INR)  

If however the salary was not adjusted downwards for the lower cost of living (a common practice amongst multinational organisations), and the hardship allowance was added, the Bangalore salary would equate to 6,325,774 (INR) which would mean the expatriate would be gaining from a 35.4% cheaper cost of living and a 30% hardship allowance, and as a result could afford a far higher standard of living in India. As recently as early last year, this sort of package would have been realistic.  However in today’s depressed global economy it is less likely.

In assessing how much to pay an Expatriate in India, it is important to take into account the relative difference in the cost of living as well as the relative hardship.

Steven Coleman runs the www.xpatulator.com website that provides a cost of living calculator and a cost of living allowance calculator used for cost of living comparisons between 276 international cities. www.xpatulator.com uses customisable cost of living indexes together with relative hardship, exchange rate and salary to calculate an equivalent salary or cost of living allowance to ensure similar purchasing power.

Posted in cost of living | Tagged , , | Comments Off on Expatriate Cost of Living India

A New Approach to Expatriate Pay

The challenges of ensuring expatriates are paid fair salaries across different countries, in the current economic climate, of the credit crisis together with rapid currency and inflation fluctuations are increasingly complex.

The current economic climate has made it necessary to constantly review expatriate salaries. Rapidly fluctuating exchange rates and inflation can increase or decrease the amount of salary paid, and significantly impact purchasing power both positively and negatively in a very short period of time. The approach many organizations have taken is to convert a spendable percentage (typically 60%) of the expatriate’s salary into the host country currency on a monthly basis and to provide non-cash benefits such as accommodation, transport, education of children etc. This can result in employers paying too much or too little salary in these volatile times.

Too Much: The expatriate experiences short-term upside, as a result of a change in the exchange rate. A fall in the value of the host country currency against the home country currency, without an increase in the prices of goods and services in the host country, results in the expatriate having increased purchasing power. It may appear for a while that all is well. The expatriate has an unexpected windfall. A wise expatriate will save this windfall knowing that the situation will not be permanent. Either the exchange rate will adjust back to where it was or prices and inflation will begin to increase until economic equilibrium is achieved. The reality is, that in the short-term the employer will be faced with increased overall salary costs, and will eventually have to deal with disappointed expatriates when the trend inevitably reverses itself and their purchasing power drops again to realistic levels.

Too Little: The expatriate experiences short-term downside as a result of a change in the exchange rate. An increase in the value of the host country currency against the home country currency, without a decrease in the prices of goods and services in the host country, results in the expatriate having reduced purchasing power. This is when the employer faces complaints from expatriates unable to make ends meet. Prices of goods and services have remained the same in the host country but as a result of the change in the exchange rate, the expatriate receives less salary in local currency. In the long term either the exchange rate will adjust back to where it was, or prices and inflation will begin to decrease until economic equilibrium is achieved. The reality is that in the short-term the employer will be faced with decreased overall salary costs and will have to deal quickly with unhappy expatriates.

Clearly the approach on converting a portion of the salary into host country currency on a monthly basis does not work any more.

The expatriate compensation questions that employers must consider:

-What amount of salary will ensure that the expatriate will have the same purchasing power overseas as they have at home?

-What process / tool will be used to ensure the salary retains its purchasing power when inflation and exchange rates change?

New Approach: The ideal approach is for the employer to decide on a process / tool that establishes and maintains the expatriate’s salary purchasing power. The Salary Purchasing Power Parity (SPPP) approach is one such approach and involves the following steps:

-Committed Salary: Decide what amount / portion of the current salary (in home currency) will remain in the home country to meet committed expenses such as mortgage commitments, retirement funding, savings etc.

-Home Gross Spendable Salary: Establish what amount / portion of the current salary (in home currency) is spent in maintaining the expatriates current standard of living / lifestyle. What will the expatriate need to spend their salary on in the host country? For example will accommodation be provided or will the expatriate pay rent, will healthcare be provided etc.

-Home Net Spendable Salary: Establish the net spendable salary by deducting the amount of tax, social contributions and any other statutory deductions applicable in the home country to the Home Gross Spendable Salary.

-Host Net Spendable Salary: Use the established amount of Home Net Spendable Salary in home currency, to calculate the amount of Host Net Spendable Salary required in the host country, in order for the expatriate to have the same amount of purchasing power as they have in their home country. The calculation comprises 4 factors:
1) The difference in the cost of living index for the same basket of goods and services between the home and host country applicable for the spendable salary.
2) The difference in hardship that the expatriate and their family are likely to experience.
3) The exchange rate between the home and host country.
4) The Net Spendable Salary

-Host Gross Salary: The Host Net Spendable Salary is “grossed up” by the amount of tax, social contributions and any other statutory deductions applicable in the host country, to establish the host gross salary that will provide the expatriate with the same standard of living as they had in their home country.

The Host Gross Salary is established in local host currency. As a result it is no longer subject to changes in the exchange rate. Over time the salary may be eroded by local inflation which will be reflected in the cost of living indexes. It is recommended that the Host Gross Salary be reviewed on a quarterly basis, to monitor the impact of any change in cost of living and the exchange rate.

Steven Coleman runs the most comprehensive international cost of living website available http://www.xpatulator.com an internet service that provides free cost of living and hardship information for 276 global locations to registered users. The premium content calculators allow you to customise your own cost of living index by choosing your own basket groups and includes a COLA calculator. Follow Steven on twitter
http://twitter.com/steveninseattle/.

Posted in compensation, cost of living, cost of living calculator, cost of living comparison, Expatriate Pay, moving, moving to, relocating, relocation, salary | Comments Off on A New Approach to Expatriate Pay

How to Calculate a Cost of Living Allowance

A Cost of Living Allowance (COLA) is a salary supplement paid to employees to cover differences in the cost of living, particularly as a result of an international assignment.

The amount of COLA should enable an expatriate to be able to purchase the same basket of goods and services in the host location as they could in their home country. The basis for calculating a COLA is the Cost of Living Index (COLI) which indexes the costs of the same basket of goods and services in different geographic locations. COLA is a simple accurate method of measuring fluctuating salary purchasing power and ensuring parity.

Cost of Living Index
Our cost of Living Indexes measure the cost of 230 products and services across 13 different basket groups in 276 cities across the globe. The data is gathered by a team of research analysts who survey comparable items that are available internationally. A minimum of 3 prices for the same brand/size/volume of product is used to determine the average price for each item in each location. The items are priced on a quarterly basis and tend to rise and fall with inflation. The 13 different basket categories are as follows:
· Alcohol & Tobacco: Alcoholic beverages and tobacco products
Alcohol at Bar
Beer
Cigarettes
Locally Produced Spirit
Whiskey
Wine
· Clothing: Clothing and footwear products
Business Suits
Casual Clothing
Children’s Clothing and footwear
Coats and hats
Evening Wear
Shoe Repairs
Underwear
· Communication
Home Telephone Rental and Call Charges
Internet Connection and service provider fees
Mobile / Cellular Phone Contract and Calls
· Education
Crèche / Pre-School Fees
High School / College Fees
Primary School Fees
Tertiary Study Fees
· Furniture & Appliances: Furniture, household equipment and household appliances
DVD Player
Fridge Freezer
Iron
Kettle, Toaster, Microwave
Light Bulbs
Television
Vacuum Cleaner
Washing Machine
· Groceries: Food, non-alcoholic beverages and cleaning material
Baby Consumables
Baked Goods
Baking
Canned Foods
Cheese
Cleaning Products
Dairy
Fresh Fruits
Fresh Vegetables
Fruit Juices
Frozen
Meat
Oil & Vinegars
Pet Food
Pre-Prepared Meals
Sauces
Seafood
Snacks
Soft Drinks
Spices & Herbs
· Healthcare: General Healthcare, Medical and Medical Insurance
General Practitioner Consultation rates
Hospital Private Ward Daily Rate
Non-Prescription Medicine
Private Medical Insurance / Medical Aid Contributions
· Household: Housing, water, electricity, household gas, household fuels, local rates and residential taxes
House / Flat Mortgage
House / Flat Rental
Household Electricity Consumption
Household Gas / Fuel Consumption
Household Water Consumption
Local Property Rates / Taxes / Levies
· Miscellaneous: Stationary, Linen and general goods and services
Domestic Help
Dry Cleaning
Linen
Office Supplies
Newspapers and Magazines
Postage Stamps
· Personal Care: Personal Care products and services
Cosmetics
Haircare
Moisturiser / Sun Block
Nappies
Pain Relief Tablets
Toilet Paper
Toothpaste
Soap / Shampoo / Conditioner
· Recreation and Culture
Books
Camera Film
Cinema Ticket
DVD and CD’s
Sports goods
Theatre Ticket
· Restaurants, Meals Out and Hotels
Business Dinner
Dinner at Restaurant (non fast food)
Hotel Rates
Take Away Drinks & Snacks (fast Food)
· Transport: Public Transport, Vehicle Costs, Vehicle Fuel, Vehicle Insurance and Vehicle Maintenance
Hire Purchase / Lease of Vehicle
Petrol / Diesel
Public Transport
Service Maintenance
Tyres
Vehicle Insurance
Vehicle Purchase

Each basket category does not count equally and are weighted in the final calculation based on expatriate spending patterns.

In order to calculate an accurate cost of living index for a specific individual the basket items that are not relevant to the individual should be excluded from the calculation. For example if education and housing is provided by the employer these basket categories would be excluded from the cost of living index calculation. This increases the accuracy of the cost of living index and makes it possible for each individual to have their own customized cost of living index based on their specific arrangements rather than using an overall “generic” index which is likely to contains costs that are not relevant to the individual.

The formula for calculating the specific cost of living index for an international assignment is as follows:

Cost of Living Index = Customized Cost of Living Index for Host City / Customized Cost of Living Index for Home City

When moving to a higher cost of living host city, the index will be greater than 1 (positive). When moving to a lower cost of living host city the index will be less than 1 (negative). Where the index is negative it means that in real terms the cost of living in the host city is lower than the home city. This means that if the negative index where to be applied to the employee’s salary, they would actually be paid proportionately less spendable salary in the host city. It is important to note that the majority of organizations do not apply a negative cost of living index because it makes it difficult to persuade an employee to take up an assignment as they tend to see it as a reduction in salary.
Examples of Cost of Living Index Calculations using our data:

Example 1) An Australian employee moving from Perth to London where healthcare and communication will be provided by the employer

More Expensive in London:
Alcohol & Tobacco +4.77%
Clothing +21.85%
Education +31.53%
Furniture & Appliances +16.03%
Groceries +16.35%
Household +50.72%
Miscellaneous +137.47%
Personal Care +11.18%
Recreation & Culture -6.82%
Restaurants Meals Out and Hotels +34.99%
Transport +19.80%

The overall difference in cost of living moving from Perth and London is +28.06%.

In this case the cost of living index is positive and would be applied as it is.

Example 2) A British employee moving from London to Mumbai where the employer will provide housing and education

More Expensive in Mumbai:
Alcohol & Tobacco -37.53%
Clothing -9.58%
Communication -44.92%
Furniture & Appliances -19.31%
Groceries -24.03%
Healthcare -31.24%
Miscellaneous -72.43%
Personal Care -24.94%
Recreation & Culture -35.73%
Restaurants Meals Out and Hotels -33.11%
Transport is -27.99%

The overall difference in cost of living moving from London Mumbai is -30.53%.

In this case the cost of living index is negative and would not be applied.

Net Spendable Salary

Differences in cost of living only impact the portion of the salary that is spendable in the host country. Items in the home country such as retirement funding, medical insurance and other home based costs are not impacted by the cost of living in the host country.

To determine the Net Spendable Salary establish what amount / portion of the current salary (in home currency) is spent in maintaining the employee’s current standard of living / lifestyle. What will the expatriate need to spend their salary on in the host country? For example will accommodation be provided or will the employee pay rent, will healthcare be provided etc. Deduct all items that are either provided in kind or are spendable in the home country. Deduct the hypothetical amount of tax, social contributions and any other statutory deductions applicable in the home country from the Spendable Salary. What is left is the Net Spendable Salary.

Cost of Living Allowance (COLA)
The formula for calculating the cost of living allowance using the above inputs is as follows:

(Net Spendable Salary X Cost of Living Index X Hardship Index X Exchange Rate) less (Net Spendable Salary X Exchange Rate) = COLA

Examples of COLA Calculations using our data

Example 1) An Australian employee with a net spendable salary of AUD$100,000 moving from Perth to London where healthcare and communication will be provided by the employer

($100,000.00 X 1.2806 X 1 X 0.4768) less ($100,000.00 X 0.4768) = COLA of £13,379.44 (GBP)

Based on all the above factors a person would require a Cost of Living Allowance of £13,379.44 (GBP), in addition to their current salary of 100,000.00 Australian Dollar (AUD) to compensate for relocating from Perth to London. This Cost of Living Allowance compensates for the overall cost of living difference of +28.06% and the relative difference in hardship of 0%.

Example 2) A British employee with a net spendable salary of £18,000 moving from London to Mumbai where the employer will provide housing and education

Note: Because the Cost of Living Index is negative it is not applied.

(£18,000.00 X 1 X 1.3 X 67.2852) less (£18,000.00 X67.2852) = COLA of 363,340.32 Indian Rupee

Based on all the above factors a person would require a Cost of Living Allowance of 363,340.32 (INR ), in addition to their current salary of £18,000.00 British Pound (GBP ) to compensate for relocating from London to Mumbai. This Cost of Living Allowance compensates for the overall cost of living difference of [-30.53%] and the relative difference in hardship of 30%.

COLA Payment
The COLA is paid as a salary supplement (i.e. as an additional allowance) net of tax in the host country. If the COLA is a taxable allowance in the host country it should be grossed up in order that the full amount of calculated COLA is paid net of tax given that the basis of the calculation is Net Spendable Salary. The COLA is often accompanied by other allowances and benefits such as flights home, relocation / settling in allowance, and furnishing allowance.

Exchange Rate Fluctuations
Significant changes in the exchange rate can make a considerable difference in the COLA calculation. In 2008 some of the major global exchange rates changed by as much as 30-40%.

The cost of living index reflects the changes caused by inflation and exchange rates. In the short-term there may be disequilibrium between inflation and the exchange rate (the one pushes the other), however over time the cost of living index provides the most accurate view of the cost of living.

It is important to remind expatriates that when the cost of living difference is negative, and the negative value has not been applied, they have higher purchasing power in the host country than they would at home.

Where a negative cost of living index has not been applied (our recommended approach), and a change in the exchange rate indicates an upward adjustment in COLA may be required, it is recommended that the COLA should not be adjusted upward until the cost of living index becomes positive i.e. the cost of living reflects that there is a “real” increase in cost of living between home and host countries. This may mean that their would be no increase in the COLA as a result of exchange rate fluctuations for some considerable time. During this time the employee’s purchasing power decreases. But it is important to remember that until the cost of living difference becomes positive, the individual will still have a higher purchasing power than they do in their home country.

It is advisable to stipulate a currency protection rule, rather than reacting to every fluctuation in the exchange rate. For example the rule may state that COLA will be reviewed if exchange rates or local inflation move by more than +10% during a year. It is important to keep in mind that the prices of goods and services are unlikely to drop in local currency. This would only occur in a period of deflation (negative inflation). Therefore the currency protection rule would normally make provision for upward adjustments in COLA and not downward adjustments during an employee’s assignment. Downward adjustments to an existing COLA due to exchange rate fluctuations without a corresponding drop in the prices of local goods and services puts immense pressure on an employee’s host currency budget commitments and can lead to the employee experiencing financial difficulty.

Using an independent service provider provides an independent, objective basis for determining an employee’s COLA.

We recommend therefore that a COLA is calculated by applying the specific (customized) cost of living index to the net spendable salary at the beginning of the assignment and monitoring exchange rate fluctuations thereafter in addition to the annual salary review.

Steven Coleman runs the most comprehensive international cost of living website available http://www.xpatulator.com an internet service that provides free cost of living and hardship information for 276 global locations to registered users. The premium content calculators allow you to customise your own cost of living index by choosing your own basket groups and includes a COLA calculator. Follow Steven on twitter
http://twitter.com/steveninseattle.

Posted in COLA, compensation, cost of living, cost of living allowance, cost of living calculator, cost of living comparison, cost of living index, international assignment, PPP, salary, salary survey | Comments Off on How to Calculate a Cost of Living Allowance

How to Calculate a Cost of Living Allowance

A Cost of Living Allowance (COLA) is a salary supplement paid to employees to cover differences in the cost of living, particularly as a result of an international assignment.

The amount of COLA should enable an expatriate to be able to purchase the same basket of goods and services in the host location as they could in their home country. The basis for calculating a COLA is the Cost of Living Index (COLI) which indexes the costs of the same basket of goods and services in different geographic locations. COLA is a simple accurate method of measuring fluctuating salary purchasing power and ensuring parity.

Cost of Living Index
Our cost of Living Indexes measure the cost of 230 products and services across 13 different basket groups in 276 cities across the globe. The data is gathered by a team of research analysts who survey comparable items that are available internationally. A minimum of 3 prices for the same brand/size/volume of product is used to determine the average price for each item in each location. The items are priced on a quarterly basis and tend to rise and fall with inflation. The 13 different basket categories are as follows:
• Alcohol & Tobacco: Alcoholic beverages and tobacco products
o Alcohol at Bar
o Beer
o Cigarettes
o Locally Produced Spirit
o Whiskey
o Wine
• Clothing: Clothing and footwear products
o Business Suits
o Casual Clothing
o Children’s Clothing and footwear
o Coats and hats
o Evening Wear
o Shoe Repairs
o Underwear
• Communication
o Home Telephone Rental and Call Charges
o Internet Connection and service provider fees
o Mobile / Cellular Phone Contract and Calls
• Education
o Crèche / Pre-School Fees
o High School / College Fees
o Primary School Fees
o Tertiary Study Fees
• Furniture & Appliances: Furniture, household equipment and household appliances
o DVD Player
o Fridge Freezer
o Iron
o Kettle, Toaster, Microwave
o Light Bulbs
o Television
o Vacuum Cleaner
o Washing Machine
• Groceries: Food, non-alcoholic beverages and cleaning material
o Baby Consumables
o Baked Goods
o Baking
o Canned Foods
o Cheese
o Cleaning Products
o Dairy
o Fresh Fruits
o Fresh Vegetables
o Fruit Juices
o Frozen
o Meat
o Oil & Vinegars
o Pet Food
o Pre-Prepared Meals
o Sauces
o Seafood
o Snacks
o Soft Drinks
o Spices & Herbs
• Healthcare: General Healthcare, Medical and Medical Insurance
o General Practitioner Consultation rates
o Hospital Private Ward Daily Rate
o Non-Prescription Medicine
o Private Medical Insurance / Medical Aid Contributions
• Household: Housing, water, electricity, household gas, household fuels, local rates and residential taxes
o House / Flat Mortgage
o House / Flat Rental
o Household Electricity Consumption
o Household Gas / Fuel Consumption
o Household Water Consumption
o Local Property Rates / Taxes / Levies
• Miscellaneous: Stationary, Linen and general goods and services
o Domestic Help
o Dry Cleaning
o Linen
o Office Supplies
o Newspapers and Magazines
o Postage Stamps
• Personal Care: Personal Care products and services
o Cosmetics
o Haircare
o Moisturiser / Sun Block
o Nappies
o Pain Relief Tablets
o Toilet Paper
o Toothpaste
o Soap / Shampoo / Conditioner
• Recreation and Culture
o Books
o Camera Film
o Cinema Ticket
o DVD and CD’s
o Sports goods
o Theatre Ticket
• Restaurants, Meals Out and Hotels
o Business Dinner
o Dinner at Restaurant (non fast food)
o Hotel Rates
o Take Away Drinks & Snacks (fast Food)
• Transport: Public Transport, Vehicle Costs, Vehicle Fuel, Vehicle Insurance and Vehicle Maintenance
o Hire Purchase / Lease of Vehicle
o Petrol / Diesel
o Public Transport
o Service Maintenance
o Tyres
o Vehicle Insurance
o Vehicle Purchase

Each basket category does not count equally and are weighted in the final calculation based on expatriate spending patterns.

In order to calculate an accurate cost of living index for a specific individual the basket items that are not relevant to the individual should be excluded from the calculation. For example if education and housing is provided by the employer these basket categories would be excluded from the cost of living index calculation. This increases the accuracy of the cost of living index and makes it possible for each individual to have their own customized cost of living index based on their specific arrangements rather than using an overall “generic” index which is likely to contains costs that are not relevant to the individual.

The formula for calculating the specific cost of living index for an international assignment is as follows:

Cost of Living Index = Customized Cost of Living Index for Host City / Customized Cost of Living Index for Home City

When moving to a higher cost of living host city, the index will be greater than 1 (positive). When moving to a lower cost of living host city the index will be less than 1 (negative). Where the index is negative it means that in real terms the cost of living in the host city is lower than the home city. This means that if the negative index where to be applied to the employee’s salary, they would actually be paid proportionately less spendable salary in the host city. It is important to note that the majority of organizations do not apply a negative cost of living index because it makes it difficult to persuade an employee to take up an assignment as they tend to see it as a reduction in salary.
Examples of Cost of Living Index Calculations using our data:

Example 1) An Australian employee moving from Perth to London where healthcare and communication will be provided by the employer

More Expensive in London:
• Alcohol & Tobacco +4.77%
• Clothing +21.85%
• Education +31.53%
• Furniture & Appliances +16.03%
• Groceries +16.35%
• Household +50.72%
• Miscellaneous +137.47%
• Personal Care +11.18%
• Recreation & Culture -6.82%
• Restaurants Meals Out and Hotels +34.99%
• Transport +19.80%

The overall difference in cost of living moving from Perth and London is +28.06%.

In this case the cost of living index is positive and would be applied as it is.

Example 2) A British employee moving from London to Mumbai where the employer will provide housing and education

More Expensive in Mumbai:
Alcohol & Tobacco -37.53%
Clothing -9.58%
Communication -44.92%
Furniture & Appliances -19.31%
Groceries -24.03%
Healthcare -31.24%
Miscellaneous -72.43%
Personal Care -24.94%
Recreation & Culture -35.73%
Restaurants Meals Out and Hotels -33.11%
Transport is -27.99%

The overall difference in cost of living moving from London Mumbai is -30.53%.

In this case the cost of living index is negative and would not be applied.

Net Spendable Salary

Differences in cost of living only impact the portion of the salary that is spendable in the host country. Items in the home country such as retirement funding, medical insurance and other home based costs are not impacted by the cost of living in the host country.

To determine the Net Spendable Salary establish what amount / portion of the current salary (in home currency) is spent in maintaining the employee’s current standard of living / lifestyle. What will the expatriate need to spend their salary on in the host country? For example will accommodation be provided or will the employee pay rent, will healthcare be provided etc. Deduct all items that are either provided in kind or are spendable in the home country. Deduct the hypothetical amount of tax, social contributions and any other statutory deductions applicable in the home country from the Spendable Salary. What is left is the Net Spendable Salary.

Cost of Living Allowance (COLA)
The formula for calculating the cost of living allowance using the above inputs is as follows:

(Net Spendable Salary X Cost of Living Index X Hardship Index X Exchange Rate) less (Net Spendable Salary X Exchange Rate) = COLA

Examples of COLA Calculations using our data

Example 1) An Australian employee with a net spendable salary of AUD$100,000 moving from Perth to London where healthcare and communication will be provided by the employer

($100,000.00 X 1.2806 X 1 X 0.4768) less ($100,000.00 X 0.4768) = COLA of £13,379.44 (GBP)

Based on all the above factors a person would require a Cost of Living Allowance of £13,379.44 (GBP), in addition to their current salary of 100,000.00 Australian Dollar (AUD) to compensate for relocating from Perth to London. This Cost of Living Allowance compensates for the overall cost of living difference of +28.06% and the relative difference in hardship of 0%.

Example 2) A British employee with a net spendable salary of £18,000 moving from London to Mumbai where the employer will provide housing and education

Note: Because the Cost of Living Index is negative it is not applied.

(£18,000.00 X 1 X 1.3 X 67.2852) less (£18,000.00 X67.2852) = COLA of 363,340.32 Indian Rupee

Based on all the above factors a person would require a Cost of Living Allowance of 363,340.32 (INR ), in addition to their current salary of £18,000.00 British Pound (GBP ) to compensate for relocating from London to Mumbai. This Cost of Living Allowance compensates for the overall cost of living difference of [-30.53%] and the relative difference in hardship of 30%.

COLA Payment
The COLA is paid as a salary supplement (i.e. as an additional allowance) net of tax in the host country. If the COLA is a taxable allowance in the host country it should be grossed up in order that the full amount of calculated COLA is paid net of tax given that the basis of the calculation is Net Spendable Salary. The COLA is often accompanied by other allowances and benefits such as flights home, relocation / settling in allowance, and furnishing allowance.

Exchange Rate Fluctuations
Significant changes in the exchange rate can make a considerable difference in the COLA calculation. In 2008 some of the major global exchange rates changed by as much as 30-40%.

The cost of living index reflects the changes caused by inflation and exchange rates. In the short-term there may be disequilibrium between inflation and the exchange rate (the one pushes the other), however over time the cost of living index provides the most accurate view of the cost of living.

It is important to remind expatriates that when the cost of living difference is negative, and the negative value has not been applied, they have higher purchasing power in the host country than they would at home.

Where a negative cost of living index has not been applied (our recommended approach), and a change in the exchange rate indicates an upward adjustment in COLA may be required, it is recommended that the COLA should not be adjusted upward until the cost of living index becomes positive i.e. the cost of living reflects that there is a “real” increase in cost of living between home and host countries. This may mean that their would be no increase in the COLA as a result of exchange rate fluctuations for some considerable time. During this time the employee’s purchasing power decreases. But it is important to remember that until the cost of living difference becomes positive, the individual will still have a higher purchasing power than they do in their home country.

It is advisable to stipulate a currency protection rule, rather than reacting to every fluctuation in the exchange rate. For example the rule may state that COLA will be reviewed if exchange rates or local inflation move by more than +10% during a year. It is important to keep in mind that the prices of goods and services are unlikely to drop in local currency. This would only occur in a period of deflation (negative inflation). Therefore the currency protection rule would normally make provision for upward adjustments in COLA and not downward adjustments during an employee’s assignment. Downward adjustments to an existing COLA due to exchange rate fluctuations without a corresponding drop in the prices of local goods and services puts immense pressure on an employee’s host currency budget commitments and can lead to the employee experiencing financial difficulty.

Using an independent service provider provides an independent, objective basis for determining an employee’s COLA.

We recommend therefore that a COLA is calculated by applying the specific (customized) cost of living index to the net spendable salary at the beginning of the assignment and monitoring exchange rate fluctuations thereafter in addition to the annual salary review.

Steven Coleman runs the most comprehensive international cost of living website available Xpatulator.com an internet service that provides free cost of living and hardship information for 276 global locations to registered users. The premium content calculators allow you to customise your own cost of living index by choosing your own basket groups and includes a COLA calculator. Follow Steven on twitter
steveninseattle.

Posted in Uncategorized | Tagged , , , , , , , , , , , , , , , , , , , , | 2 Comments

A New Approach to Expatriate Pay

The challenges of ensuring expatriates are paid fair salaries across different countries, in the current economic climate, of the credit crisis together with rapid currency and inflation fluctuations are increasingly complex.

The current economic climate has made it necessary to constantly review expatriate salaries. Rapidly fluctuating exchange rates and inflation can increase or decrease the amount of salary paid, and significantly impact purchasing power both positively and negatively in a very short period of time. The approach many organizations have taken is to convert a spendable percentage (typically 60%) of the expatriate’s salary into the host country currency on a monthly basis and to provide non-cash benefits such as accommodation, transport, education of children etc. This can result in employers paying too much or too little salary in these volatile times.

Too Much: The expatriate experiences short-term upside, as a result of a change in the exchange rate. A fall in the value of the host country currency against the home country currency, without an increase in the prices of goods and services in the host country, results in the expatriate having increased purchasing power. It may appear for a while that all is well. The expatriate has an unexpected windfall. A wise expatriate will save this windfall knowing that the situation will not be permanent. Either the exchange rate will adjust back to where it was or prices and inflation will begin to increase until economic equilibrium is achieved. The reality is, that in the short-term the employer will be faced with increased overall salary costs, and will eventually have to deal with disappointed expatriates when the trend inevitably reverses itself and their purchasing power drops again to realistic levels.

Too Little: The expatriate experiences short-term downside as a result of a change in the exchange rate. An increase in the value of the host country currency against the home country currency, without a decrease in the prices of goods and services in the host country, results in the expatriate having reduced purchasing power. This is when the employer faces complaints from expatriates unable to make ends meet. Prices of goods and services have remained the same in the host country but as a result of the change in the exchange rate, the expatriate receives less salary in local currency. In the long term either the exchange rate will adjust back to where it was, or prices and inflation will begin to decrease until economic equilibrium is achieved. The reality is that in the short-term the employer will be faced with decreased overall salary costs and will have to deal quickly with unhappy expatriates.

Clearly the approach on converting a portion of the salary into host country currency on a monthly basis does not work any more.

The expatriate compensation questions that employers must consider:

-What amount of salary will ensure that the expatriate will have the same purchasing power overseas as they have at home?

-What process / tool will be used to ensure the salary retains its purchasing power when inflation and exchange rates change?

New Approach: The ideal approach is for the employer to decide on a process / tool that establishes and maintains the expatriate’s salary purchasing power. The Salary Purchasing Power Parity (SPPP) approach is one such approach and involves the following steps:

-Committed Salary: Decide what amount / portion of the current salary (in home currency) will remain in the home country to meet committed expenses such as mortgage commitments, retirement funding, savings etc.

-Home Gross Spendable Salary: Establish what amount / portion of the current salary (in home currency) is spent in maintaining the expatriates current standard of living / lifestyle. What will the expatriate need to spend their salary on in the host country? For example will accommodation be provided or will the expatriate pay rent, will healthcare be provided etc.

-Home Net Spendable Salary: Establish the net spendable salary by deducting the amount of tax, social contributions and any other statutory deductions applicable in the home country to the Home Gross Spendable Salary.

-Host Net Spendable Salary: Use the established amount of Home Net Spendable Salary in home currency, to calculate the amount of Host Net Spendable Salary required in the host country, in order for the expatriate to have the same amount of purchasing power as they have in their home country. The calculation comprises 4 factors:
1) The difference in the cost of living index for the same basket of goods and services between the home and host country applicable for the spendable salary.
2) The difference in hardship that the expatriate and their family are likely to experience.
3) The exchange rate between the home and host country.
4) The Net Spendable Salary

-Host Gross Salary: The Host Net Spendable Salary is “grossed up” by the amount of tax, social contributions and any other statutory deductions applicable in the host country, to establish the host gross salary that will provide the expatriate with the same standard of living as they had in their home country.

The Host Gross Salary is established in local host currency. As a result it is no longer subject to changes in the exchange rate. Over time the salary may be eroded by local inflation which will be reflected in the cost of living indexes. It is recommended that the Host Gross Salary be reviewed on a quarterly basis, to monitor the impact of any change in cost of living and the exchange rate.

Steven Coleman runs the most comprehensive international cost of living website available Xpatulator.com an internet service that provides free cost of living and hardship information for 276 global locations to registered users. The premium content calculators allow you to customise your own cost of living index by choosing your own basket groups and includes a COLA calculator. Follow Steven on twitter
steveninseattle.

Posted in Uncategorized | Tagged , , , , , , , , , , , , , , , , , , , , | Comments Off on A New Approach to Expatriate Pay

Qatar Expatriate Prospects

Thinking about looking for an overseas job?  Our analysis shows that from a pay, cost of living, exchange rate, quality of life (hardship) and long term economic stability perspective, Qatar is one of the best places in the world for expatriates to live.  Surprised?  Well consider why we say this.


While the rest of the world battles the ongoing impact of the global credit crisis, slowing economies, falling house prices, falling stock markets, exchange rate instability, a stronger US dollar and a drop in the oil price, Qatar stands out as being well positioned to ride out the global storm better than most.


The State of Qatar’s population has just recently exceeded 1.5 million people (of which more than 1 million people are expats) after several years of incredible economic growth which fuelled the demand for skills and labor.  Qatar is still relatively small compared to the UAE’s population of 4.7 million.  The precise total population within the State of Qatar, according to the Qatar Statistics Authority, as of 31st. Oct.2008 is 1,541,130 persons, made up of 1,185,575 (77%) Males and just 355,555 (23%) Females, which is indicative of the large number of unaccompanied male expatriate workers in Qatar.  Foreigners account for some 78 per cent of the population (compared to the UAE’s 84%); most of the foreign workers in Qatar are from India, Pakistan, Bangladesh, the Philippines and Arab countries.


Qatar is oil rich, but what differentiates Qatar from other petroleum producing countries is that the world’s largest gas field by far is Qatar’s offshore North Field, estimated to have 25 trillion cubic meters of gas in place—enough to last more than 200 years at optimum production levels.


Due to the distance from it’s markets, pipelines were not a practical option for Qatar. Over several decades the development of liquefied natural gas processes meant remote gas fields became more and more viable.  Liquefied natural gas or LNG is natural gas (primarily methane, CH4) that has been converted to liquid form for ease of storage or transport. Liquefied natural gas takes up about 1/600th the volume of natural gas at a stove burner tip. It is odorless, colorless, non-toxic and non-corrosive.


The costs of LNG treatment and transportation were so huge in the past that development was slow until recent times.  LNG is principally used for transporting natural gas to markets, where it is regasified and distributed as pipeline natural gas. LNG offers an energy density comparable to petrol and diesel fuels and produces less pollution, but its relatively high cost of production and the need to store it in expensive cryogenic tanks have prevented its widespread use in commercial applications.


In the early 2000s, as more players took part in investment, both in downstream and upstream, and new technologies are adopted, the prices for construction of LNG plants, receiving terminals and vessels fell, making LNG a more competitive means of energy distribution, but increasing mateRiyal costs, lack of skilled labor, shortage of professional engineers, designers, managers and other white-collar professionals and demand for construction contractors have driven up prices in the last few years. 


The commercial development of LNG is based on downstream buyers signing 20–25 year contracts with strict terms and structures for pricing. Only when the customers were confirmed and the development of a greenfield project deemed economically feasible do the sponsors of an LNG project invest in their development and operation. As a result the LNG liquefaction business has been regarded as a game of the rich, where only players with strong financial and political resources can get involved.


Global LNG demand is expected to grow considerably. The International Energy Agency estimates that European imports of gas from Africa and the Middle East (mainly in the form of LNG) will quadruple by 2030 (source: Economist, 14/4/07, p39).  The largest LNG train in operation anywhere in the world is now in Qatar.


Qatar‘s largest lender Qatar National Bank (QNB) is predicting that Qatar’s economy will grow by a further 26 percent in 2008.


Qatar’s gross domestic product (GDP) at purchasing power parity (PPP) per capita, the value of all final goods and services produced within a nation in a given year divided by the average (or mid-year) population for the same year is USD$85,638, which makes Qatar the wealthiest nation in the world according to the International Monetary Fund World Economic Outlook Database as at October 2008.


Added to the wealth, forecast long term economic growth, expatriate salary levels in Qatar are reputed to be higher than most other Gulf States in US Dollar terms.  Further good news for expats in Qatar (for now) is that the Qatar Riyal is fixed against the US Dollar.  The relative strengthening of the US Dollar against most currencies translates to a strengthening of the Qatar Riyal.  Between July and December 2008 the exchange rate has moved strongly in the favor of expatriates for most currencies.  According to the currency website Oanda the following currencies weakened against the Qatar Riyal between 1 July 2008 and 1 December 2008, resulting in increases in terms of home currency for expats working in Qatar of:


  • 47% for Australian expats;
  • 29.6% for British expats;
  • 24.3% for European expats;
  • 18.7% for Indian expats;
  • 39.3% for Indonesian expats;
  • 13.9% for Malaysian expats;
  • 11.2% for Philippine expats;
  • 11.1% for Singaporean expats;
  • 28% for South African expats


According to the recent GulfTalent report “Gulf Compensation Trends 2008” Basic Salaries rose in Qatar by 10.6% in 2007 and 12.7% in 2008.


The rapid growth in Qatar has however pushed up the cost of living for expats particularly that of housing costs.  WWW.Xpatulator.com data shows that in November 2008 Doha was ranked the 45th most expensive city in the world for expatriates to live with an overall cost of living index of 100.64 (New York=100 and ranks 50th).  To put this in context with some of the comparator global cities:


Qatar is more expensive for expatriates to live than places such as;

Rank Location (Overall Cost of Living Index New York=100)

56 Germany, Berlin (98.18);

62 Australia, Melbourne (95.88);

66 Singapore, Singapore (94.6);

68 USA, Los Angeles Calif (93.93);

82 Bahrain, Manama (90.82);

100 United Arab Emirates, Abu Dhabi (87.16);

116 United Kingdom, Birmingham (84.76);

126 Philippines, Manila (82.07);

130 Indonesia, Jakarta (81.76);

171 India, Mumbai (76.04);

181 Kuwait, Kuwait City (75.22);

183 Saudi Arabia, Riyadh (75.08);

206 India, New Delhi (71.4);

239 South Africa, Johannesburg (64.51);

241 Egypt, Cairo (64.18);

248 Pakistan, Lahore (59.48);

255 Pakistan, Karachi (57.72)


However Qatar is less expensive for expatriates to live than places such as;

Rank Location (Overall Cost of Living Index New York=100)

6 United Kingdom, London (118.23);

12 Ireland, Dublin (112.65);

29 Australia, Sydney (106.52);

34 United Arab Emirates, Dubai (103.36)


Has Qatar peeked at it’s current rank as the 45th most expensive place in the world for expatriates to live?  It appears unlikely to have peeked in the immediate term due to high inflation in 2008 which, according to the Qatar General Secretariat for Development Planning (GSDP) as at mid-2008, is 16.6% per annum overall.  The high inflation is being driven by two key inflationary elements “Rent, Fuel and Energy” at 24.4% and “Food, beverages & tobacco” at 22%. It is likely that Qatar will peek at around 40th most expensive place in the world for expatriates in 2009 before the global economy begins to pick up again and other countries cost of living increase relative to Qatar from 2010.


Qatar inflation forecasts for 2009 vary, but the consensus appears to be that the rate of inflation will be less severe than in 2008, and is expected to return towards slightly above 10%.


The general consensus is that the global recession will inevitably also impact Qatar, however it is likely to be less severe given the exposure to Petroleum in general and LNG in particular.  Once again Qatar is well positioned in that one of the expected consequences of the recession in Qatar’s case is that inflationary pressures should ease as property demand cools along with a stabilization of rent increases, which have been severe in recent years, given that the slow down allows supply to catch up with demand.


So, if you had never given Qatar consideration as an expatriate destination of choice, I am sure you should now.


Steven Coleman runs the most comprehensive international cost of living website available http://www.xpatulator.com an internet service that provides free cost of living and hardship information for 276 global locations to registered users. The premium content calculators allow you to customise your own cost of living index by choosing your own basket groups.


http://www.xpatulator.com/ 


Posted in Expatriate Prospects | Tagged , | Comments Off on Qatar Expatriate Prospects

November 2008 – International Cost of Living Comparison – Global Trends

The ongoing impact of the credit crisis, slowing global economies, falling house prices, global stock market and exchange rate volatility, together with the US dollar strengthening against most currencies are all factors contributing to a major change in the global cost of living rankings.

The International Cost of Living Comparison comprises indexes for each of 276 global locations. The indexes are calculated using the prices for specific quantities of the same goods and services in each location, based on expatriate spending patterns across 13 broad categories (Basket Groups).

The latest international cost of living ranking, together with the overall cost of living index as at 24 November 2008 is as follows:

Rank Location (Overall Cost of Living Index New York=100)

1. Japan, Tokyo (126.03)
2. Norway, Oslo (123.74)
3. Denmark, Copenhagen (121.11)
4. Switzerland, Geneva (119.59)
5. Brazil, Brasilia (118.53)
6. United Kingdom, London (118.23)
7. Greenland, Nuuk (117.14)
8. Switzerland, Zurich (116.18)
9. Hungary, Budapest (114.36)
10. Russia, Moscow (113.41)
11. Nigeria, Lagos (112.69)
12. Ireland, Dublin (112.65)
13. New Caledonia, Noumea (112.43)
14. France, Paris (112.38)
15. Chad, N’Djamena (111.3)
16. Italy, Milan (111.19)
17. Cameroon, Douala (111.06)
18. Liechtenstein, Vaduz (110.89)
19. San Marino, San Marino (110.78)
20. Monaco, Monaco (109.83)
21. Czech Republic, Prague (109.81)
22. Austria, Vienna (109.68)
23. Slovakia, Bratislava (109.31)
24. Isle of Man, Douglas (108.97)
25. Poland, Warsaw (107.63)
26. Bermuda, Hamilton (107.53)
27. Italy, Rome (107.29)
28. Finland, Helsinki (107.07)
29. Australia, Sydney (106.52)
30. USA, San Francisco Calif (104.53)
31. Cote D’Ivoire, Abidjan (104.4)
32. Venezuela, Caracas (104.02)
33. China, Hong Kong (103.43)
34. United Arab Emirates, Dubai (103.36)
35. Croatia, Zagreb (103.29)
36. Angola, Luanda (103.27)
37. Belgium, Brussels (103.19)
38. Netherlands, Amsterdam (102.33)
39. Jersey, Saint Helier (102.24)
40. Papua New Guinea, Port Moresby (102.22)
41. Korea Republic of, Seoul (101.94)
42. Iceland, Reykjavík (101.66)
43. Ukraine, Kiev (101.2)
44. Guernsey, St Peter Port (100.68)
45. Qatar, Doha (100.64)
46. Central African Republic, Bangui (100.58)
47. Spain, Madrid (100.26)
48. USA, San Jose Calif (100.13)
49. Falkland Islands, Stanley (100)
50. USA, New York NY (100)
51. Sweden, Stockholm (99.76)
52. USA, Boston Mass (99.63)
53. Cameroon, Yaounde (98.84)
54. Mali, Bamako (98.74)
55. Benin, Cotonou (98.6)
56. Germany, Berlin (98.18)
57. Micronesia, Palikir (97.98)
58. Gabon, Libreville (97.77)
59. Canada, Toronto (97.39)
60. Germany, Bonn (96.38)
61. Vatican City, Vatican City (96.23)
62. Australia, Melbourne (95.88)
63. Australia, Canberra (95.88)
64. Estonia, Tallinn (95.08)
65. Turkey, Ankara (94.87)
66. Singapore, Singapore (94.6)
67. Guinea-Bissau, Bissau (94.24)
68. USA, Los Angeles Calif (93.93)
69. Palau, Melekeok (93.85)
70. Luxembourg, Luxembourg (93.77)
71. Canada, Vancouver (93.48)
72. Portugal, Lisbon (92.84)
73. Australia, Perth (92.82)
74. Germany, Frankfurt (92.81)
75. Azerbaijan, Baku (92.76)
76. Gibraltar, Gibraltar (92.33)
77. Comores, Moroni (92.04)
78. USA, Washington DC (91.8)
79. USA, Philadelphia Pa (91.49)
80. Nauru, Yaren (91.16)
81. Kazakhstan, Almaty (90.99)
82. Bahrain, Manama (90.82)
83. USA, San Diego Calif (90.7)
84. Bahamas, Nassau (90.63)
85. Togo, Lome (90.11)
86. Taiwan, Taipei (90.07)
87. Haiti, Port-au-Prince (90)
88. Senegal, Dakar (89.57)
89. Saint Helena, Jamestown (89.26)
90. USA, Baltimore Md (89.25)
91. United Kingdom, Glasgow (88.88)
92. Djibouti, Djibouti (88.45)
93. Niger, Niamey (88.38)
94. Zambia, Lusaka (88.36)
95. USA, Seattle Wash (88.3)
96. Andorra, Andorra la Vella (88.13)
97. Vietnam, Hanoi (88.03)
98. Tonga, Nuku’Alofa (87.34)
99. Gambia, Banjul (87.23)
100.United Arab Emirates, Abu Dhabi (87.16)
101.Cayman Islands, George Town (86.81)
102.Sudan, Khartoum (86.64)
103.Greece, Athens (86.59)
104.Barbados, Bridgetown (86.5)
105.USA, Portland Ore (86.1)
106.Sierra Leone, Freetown (85.92)
107.Equatorial Guinea, Malabo (85.89)
108.USA, Chicago Ill (85.73)
109.Romania, Bucharest (85.55)
110.USA, Miami Fla (85.54)
111.Marshall Islands, Majuro (85.41)
112.Cyprus, Nicosia (85.26)
113.Malta, Velletta (84.99)
114.Moldova, Chisinau (84.89)
115.Ghana, Accra (84.89)
116.United Kingdom, Birmingham (84.76)
117.Canada, Montreal (84.37)
118.Algeria, Algiers (84.01)
119.Israel, Jerusalem (83.82)
120.Australia, Brisbane (83.29)
121.Burkina Faso, Ouagadougou (82.92)
122.Lebanon, Beirut (82.74)
123.Jordan, Amman (82.41)
124.Guinea, Conakry (82.16)
125.Jamaica, Kingston (82.11)
126.Philippines, Manila (82.07)
127.Georgia Republic of, Tbilisi (82.03)
128.Congo Democratic Rep, Kinshasa (81.84)
129.Seychelles, Victoria (81.78)
130.Indonesia, Jakarta (81.76)
131.USA, Las Vegas Nev (81.75)
132.Lithuania, Vilnius (81.67)
133.Vanuatu, Port Vila (81.35)
134.Grenada, Saint George’s (81.23)
135.Trinidad and Tobago, Port-of-Spain (81.13)
136.Mozambique, Maputo (80.82)
137.New Zealand, Auckland (80.71)
138.Samoa, Apia (80.64)
139.Congo, Brazzaville (80.14)
140.Armenia, Yerevan (80.13)
141.Albania, Tirana (80.1)
142.Martinique, Fort-de-France (80.09)
143.Latvia, Riga (79.92)
144.Thailand, Bangkok (79.86)
145.Sao Tome and Principe, Sao Tome (79.79)
146.USA, Denver Colo (79.74)
147.China, Beijing (79.73)
148.Fiji, Suva (78.99)
149.Slovenia, Ljubljana (78.85)
150.Canada, Ottawa (78.82)
151.Tuvalu, Funafuti (78.78)
152.Myanmar, Yangon (78.51)
153.Puerto Rico, San Juan (78.49)
154.Kenya, Nairobi (78.4)
155.USA, Phoenix Ariz (78.26)
156.Mauritius, Port Louis (78.25)
157.Madagascar, Antananarivo (78.24)
158.USA, Tampa Fla (78.22)
159.Serbia, Belgrade (78.13)
160.Kiribati, South Tarawa (78.06)
161.Guam, Hagatna (77.8)
162.Brunei, Bandar Seri Begawan (77.72)
163.Uruguay, Montevideo (77.41)
164.Colombia, Bogota (77.23)
165.USA, Atlanta GA (76.99)
166.Morocco, Rabat (76.93)
167.USA, Milwaukee Wis (76.77)
168.Paraguay, Asuncion (76.49)
169.Mexico, Mexico City (76.13)
170.USA, Columbus Ohio (76.06)
171.India, Mumbai (76.04)
172.Tanzania, Dar es Salaam (76)
173.Solomon Islands, Honiara (75.93)
174.USA, Cleveland Ohio (75.84)
175.USA, Detroit Mich (75.74)
176.Liberia, Monrovia (75.63)
177.USA, Austin Tex (75.57)
178.USA, Dallas Tex (75.47)
179.USA, Jacksonville Fla (75.47)
180.Australia, Adelaide (75.39)
181.Kuwait, Kuwait City (75.22)
182.Bulgaria, Sofia (75.14)
183.Saudi Arabia, Riyadh (75.08)
184.USA, Pittsburgh Penn (74.54)
185.Timor-Leste, Dili (74.29)
186.Iran, Tehran (74.24)
187.USA, Indianapolis Ind (74.13)
188.USA, Fort Worth Tex (73.64)
189.Somalia, Mogadishu (73.49)
190.Maldives, Male (73.48)
191.USA, Charlotte NC (73.47)
192.USA, Houston Tex (73.36)
193.Chile, Santiago (73.01)
194.Mauritania, Nouakchott (72.99)
195.Botswana, Gaberone (72.86)
196.Cape Verde, Praia (72.81)
197.USA, El Paso Tex (72.61)
198.Uganda, Kampala (72.25)
199.Afghanistan, Kabul (72.13)
200.Antigua and Barbuda, Saint John’s (72.04)
201.USA, St Louis MO (71.93)
202.Malaysia, Kuala Lumpur (71.82)
203.Peru, Lima (71.7)
204.Korea Democratic Republic of, Pyongyang (71.62)
205.Kosovo, Pristina (71.55)
206.India, New Delhi (71.4)
207.Belarus, Minsk (71.28)
208.Malawi, Lilongwe (71.24)
209.Saint Kitts and Nevis, Basseterre (71.07)
210.USA, Memphis Tenn (71.02)
211.India, Chennai (70.76)
212.Kyrgyzstan, Bishkek (70.29)
213.Burundi, Bujumbura (70.07)
214.Macedonia, Skopje (70.02)
215.USA, San Antonio Tex (70.02)
216.Guatemala, Guatemala City (69.74)
217.Honduras, Tegucigalpa (69.57)
218.Saint Vincent and the Grenadines, Kingstown (69.5)
219.Canada, Calgary (69.46)
220.India, Calcutta (69.31)
221.India, Hyderabad (68.85)
222.Dominica, Roseau (68.79)
223.Rwanda, Kigali (68.75)
224.Panama, Panama City (68.58)
225.Guyana, Georgetown (68.58)
226.China, Shanghai (68.48)
227.Syria, Damascus (67.99)
228.Montenegro, Podgorica (67.75)
229.Laos, Vientiane (67.43)
230.Ethiopia, Addis Ababa (66.87)
231.Cuba, Havana (66.61)
232.Belize, Belmopan (66.33)
233.Nicaragua, Managua (65.89)
234.Nepal, Kathmandu (65.67)
235.Dominican Republic, Santo Domingo (64.93)
236.Tunisia, Tunis (64.87)
237.Suriname, Paramaribo (64.75)
238.India, Bangalore (64.56)
239.South Africa, Johannesburg (64.51)
240.Costa Rica, San Jose (64.47)
241.Egypt, Cairo (64.18)
242.El Salvador, San Salvador (63.34)
243.Swaziland, Mbabane (63.11)
244.Mongolia, Ulaanbaatar (62.85)
245.South Africa, Pretoria (62.71)
246.Oman, Muscat (61.61)
247.Saint Lucia, Castries (61.2)
248.Pakistan, Lahore (59.48)
249.Tajikistan, Dushanbe (59.25)
250.South Africa, Cape Town (58.99)
251.Namibia, Windhoek (58.89)
252.Sri Lanka, Colombo (58.51)
253.Pakistan, Islamabad (58.33)
254.Iraq, Baghdad (58.25)
255.Pakistan, Karachi (57.72)
256.Lesotho, Maseru (57.49)
257.Argentina, Buenos Aires (57.46)
258.Bangladesh, Dhaka (57.03)
259.Bhutan, Thimphu (56.78)
260.Bolivia, La Paz (56.66)
261.China, Macao (56.41)
262.South Africa, Durban (56.07)
263.Bosnia and Herzegovina, Sarajevo (54.35)
264.Ecuador, Quito (53.83)
265.Uzbekistan, Tashkent (53.03)
266.Libya, Tripoli (52.74)
267.China, Shenzhen (51.65)
268.Eritrea, Asmara (50.72)
269.China, Dalian (50.54)
270.China, Wuhan (49.93)
271.China, Guangzhou (47.28)
272.Cambodia, Phnom Penh (45.65)
273.Yemen, Sanaa (45.6)
274.Turkmenistan, Ashgabat (38.77)
275.China, Tianjin (29.5)
276.Zimbabwe, Harare (17.12)

About The Author: Steven Coleman runs the most comprehensive international cost of living website available http://www.xpatulator.com an internet service that provides free cost of living and hardship information for 276 global locations to registered users. The premium content calculators allow you to customise your own cost of living index by choosing your own basket groups.

http://www.xpatulator.com/

Posted in International cost of living comparison, International Cost of Living Rank; International Cost of Living Index | Comments Off on November 2008 – International Cost of Living Comparison – Global Trends