
The America’s Cost of Living Rankings for April 2012

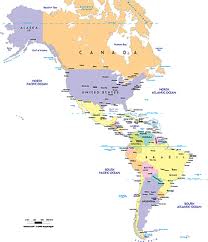
ImageBrazil – Sao Paulo and Rio de Janeiro come in fifth and ninth respectively as two of the overall most expensive places to live in the world, with Caracas, Venezuela coming in sixth. 

 
Of the top 50 most expensive destinations to live based on the overall cost of living, the Americas have 8 locations listed. 


The latest international cost of living rankings are based on data collected during the past 3 months for 780 international locations, covering every country world-wide. 
 
The cost of living (COL) data collected is representative of an expatriate lifestyle. The components of the COL data are local prices for fixed quantities of the same goods and services in each location, local inflation and exchange rates. Prices in each location are affected by availability (i.e. supply & demand) as well as local pricing regulations and taxes on goods and services (e.g.premiums on luxury brands). Local inflation is usually representative of local price increases which in turn impacts an expatriates purchasing power in the host country. The exchange rate impacts both the price of imports to the host country and the expatriate assignment salary calculation between the home and host country. The cost of living has a significant impact on the purchasing power of an expatriate’s salary package.
 
About Xpatulator.com’s Cost of Living Data
Xpatulator.com’s cost of living data is based on prices for the same quantity and quality of goods and services, representative of expatriate lifestyle, in each city. The data is collected and updated on a quarterly basis. The cost of living data is used by Xpatulator.com clients to calculate salary purchasing power parity, cost of living allowances, and customized (i.e. clients can select their own base city) cost of living indexes for expatriate assignments online, using Xpatulator.com’s 3 premium content calculators.
 
The 13 basket groups do not count equally and are weighted according to expatriate expenditure norms as follows (weighting percentage is in brackets):
 
1. Alcohol & Tobacco (2%): Alcoholic beverages and tobacco products.
2. Clothing (2.5%): Clothing and footwear products.
3. Communication (2%): Telephone, Internet, Mobile Contract and Calls.
4. Education (5%): Creche Fees, School Fees, College Fees, and Tertiary Study Fees.
5. Furniture & Appliances (5%): Furniture, household equipment and appliances.
6. Groceries (16.5%): Food, non-alcoholic beverages and cleaning materials.
7. Healthcare (5%): Doctor Consultation rates, Private Ward Rate, Prescription Medicine, and Private Medical Insurance Contributions.
8. Household (30%): Housing rental, utilities, local rates and residential taxes.
9. Miscellaneous (3%): Stationary, Linen and general goods and services.
10. Personal Care (3%): Personal Care products and services.
11. Recreation & Culture (6%): Books, Camera Film, Cinema Ticket, DVD and CD’s, Sports goods, Theatre Tickets.
12. Restaurants Meals Out and Hotels (2%): Dinner at Restaurant (non fast food), Hotel Rates, Take Away, Drinks & Snacks (fast Food).
13. Transport (18%): Public Transport, Vehicle Costs, Vehicle Fuel, Vehicle Insurance and Vehicle Maintenance.
Posted in Uncategorized | Tagged , , , , , , | Comments Off on The America’s Cost of Living Rankings for April 2012

Africa Cost of Living Rankings for April 2012

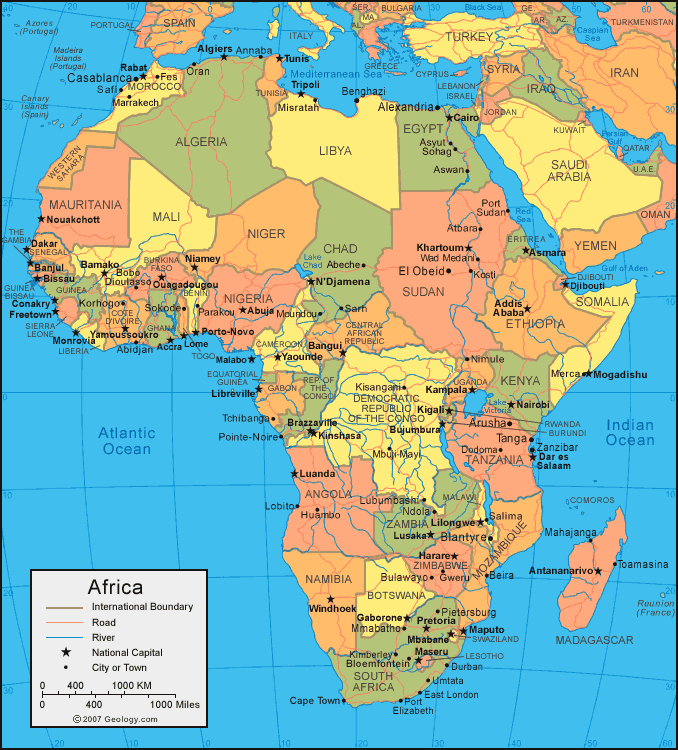
ImageAngola, Luanda comes in 27th and Angola 36th in the overall most expensive places to live in the world.
 
Of the top 50 most expensive destinations to live based on the overall cost of living, Africa has 2 locations listed. 
 
 
The latest international cost of living rankings are based on data collected during the past 3 months for 780 international locations, covering every country world-wide. 
 
The cost of living (COL) data collected is representative of an expatriate lifestyle. The components of the COL data are local prices for fixed quantities of the same goods and services in each location, local inflation and exchange rates. Prices in each location are affected by availability (i.e. supply & demand) as well as local pricing regulations and taxes on goods and services (e.g.premiums on luxury brands). Local inflation is usually representative of local price increases which in turn impacts an expatriates purchasing power in the host country. The exchange rate impacts both the price of imports to the host country and the expatriate assignment salary calculation between the home and host country. The cost of living has a significant impact on the purchasing power of an expatriate’s salary package.
 
About Xpatulator.com’s Cost of Living Data
Xpatulator.com’s cost of living data is based on prices for the same quantity and quality of goods and services, representative of expatriate lifestyle, in each city. The data is collected and updated on a quarterly basis. The cost of living data is used by Xpatulator.com clients to calculate salary purchasing power parity, cost of living allowances, and customized (i.e. clients can select their own base city) cost of living indexes for expatriate assignments online, using Xpatulator.com’s 3 premium content calculators.
 
The 13 basket groups do not count equally and are weighted according to expatriate expenditure norms as follows (weighting percentage is in brackets):
 
1. Alcohol & Tobacco (2%): Alcoholic beverages and tobacco products.
2. Clothing (2.5%): Clothing and footwear products.
3. Communication (2%): Telephone, Internet, Mobile Contract and Calls.
4. Education (5%): Creche Fees, School Fees, College Fees, and Tertiary Study Fees.
5. Furniture & Appliances (5%): Furniture, household equipment and appliances.
6. Groceries (16.5%): Food, non-alcoholic beverages and cleaning materials.
7. Healthcare (5%): Doctor Consultation rates, Private Ward Rate, Prescription Medicine, and Private Medical Insurance Contributions.
8. Household (30%): Housing rental, utilities, local rates and residential taxes.
9. Miscellaneous (3%): Stationary, Linen and general goods and services.
10. Personal Care (3%): Personal Care products and services.
11. Recreation & Culture (6%): Books, Camera Film, Cinema Ticket, DVD and CD’s, Sports goods, Theatre Tickets.
12. Restaurants Meals Out and Hotels (2%): Dinner at Restaurant (non fast food), Hotel Rates, Take Away, Drinks & Snacks (fast Food).
13. Transport (18%): Public Transport, Vehicle Costs, Vehicle Fuel, Vehicle Insurance and Vehicle Maintenance.
 
About Xpatulator.com
Xpatulator.com is the most comprehensive source of international cost of living information. We provide free international cost of living overviews and rank information covering 13 cost of living baskets and every country around the world as well as premium content calculators.
 
Founded in 2007, Xpatulator.com’s mission is to organize the world’s cost of living indices, exchange rates and relative hardship indices and make it accessible and useful to all.
Posted in Uncategorized | Tagged , , , , | Comments Off on Africa Cost of Living Rankings for April 2012

Europe Cost of Living Rankings for April 2012

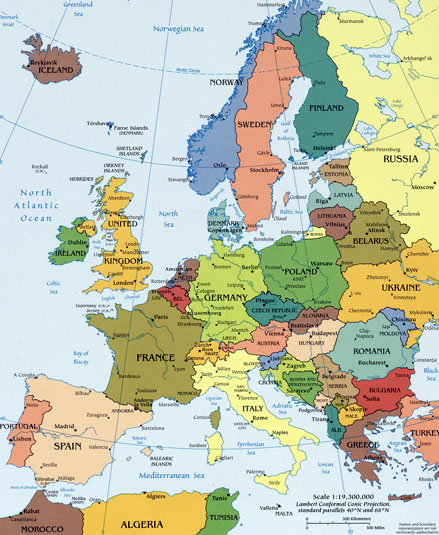
ImageAs the third overall most expensive place to live in the world, Zurich has an overall cost of living index of 134.72. The overall index is comprised of 13 different basket groups. The assumption using the overall index is that everything is paid from the salary package. In addition, the cost of living calculations are weighted according to typical monthly international expatriate spending patterns. The Household Accommodation Basket for example, has a weighting of 30%, while the Groceries Basket has a weighting of 16.5%. That means that an international expatriate who, for example, earns 10,000 would typically spend 3,000 (30% of 10,000) on housing and 1,650 on groceries.
 
Of the top 50 most expensive destinations to live based on the overall cost of living, Europe has 12 locations listed. 

The latest international cost of living rankings are based on data collected during the past 3 months for 780 international locations, covering every country world-wide. 

 
The cost of living (COL) data collected is representative of an expatriate lifestyle. The components of the COL data are local prices for fixed quantities of the same goods and services in each location, local inflation and exchange rates. Prices in each location are affected by availability (i.e. supply & demand) as well as local pricing regulations and taxes on goods and services (e.g.premiums on luxury brands). Local inflation is usually representative of local price increases which in turn impacts an expatriates purchasing power in the host country. The exchange rate impacts both the price of imports to the host country and the expatriate assignment salary calculation between the home and host country. The cost of living has a significant impact on the purchasing power of an expatriate’s salary package.
 
The top 20 Most expensive places to live in Europe – Overall Cost of Living & All Baskets:
  1. Switzerland, Zurich
  2. Switzerland, Geneva
  3. Switzerland, All Areas
  4. Norway, Oslo
  5. Liechtenstein, Vaduz
  6. United Kingdom, London
  7. Norway, All Areas
  8. Russia, Moscow
  9. Liechtenstein, All Areas
  10. Denmark, Copenhagen
  11. Denmark, All Areas
  12. Monaco, Monaco
  13. France, Paris
  14. Austria, Vienna
  15. Jersey, Saint Helier
  16. Jersey, All Areas
  17. Finland, Helsinki
  18. Italy, Rome
  19. Germany, Frankfurt
  20. Austria, All Areas
About Xpatulator.com’s Cost of Living Data
Xpatulator.com’s cost of living data is based on prices for the same quantity and quality of goods and services, representative of expatriate lifestyle, in each city. The data is collected and updated on a quarterly basis. The cost of living data is used by Xpatulator.com clients to calculate salary purchasing power parity, cost of living allowances, and customized (i.e. clients can select their own base city) cost of living indexes for expatriate assignments online, using Xpatulator.com’s 3 premium content calculators.
 
The 13 basket groups do not count equally and are weighted according to expatriate expenditure norms as follows (weighting percentage is in brackets):
 
1. Alcohol & Tobacco (2%): Alcoholic beverages and tobacco products.
2. Clothing (2.5%): Clothing and footwear products.
3. Communication (2%): Telephone, Internet, Mobile Contract and Calls.
4. Education (5%): Creche Fees, School Fees, College Fees, and Tertiary Study Fees.
5. Furniture & Appliances (5%): Furniture, household equipment and appliances.
6. Groceries (16.5%): Food, non-alcoholic beverages and cleaning materials.
7. Healthcare (5%): Doctor Consultation rates, Private Ward Rate, Prescription Medicine, and Private Medical Insurance Contributions.
8. Household (30%): Housing rental, utilities, local rates and residential taxes.
9. Miscellaneous (3%): Stationary, Linen and general goods and services.
10. Personal Care (3%): Personal Care products and services.
11. Recreation & Culture (6%): Books, Camera Film, Cinema Ticket, DVD and CD’s, Sports goods, Theatre Tickets.
12. Restaurants Meals Out and Hotels (2%): Dinner at Restaurant (non fast food), Hotel Rates, Take Away, Drinks & Snacks (fast Food).
13. Transport (18%): Public Transport, Vehicle Costs, Vehicle Fuel, Vehicle Insurance and Vehicle Maintenance.

 
About Xpatulator.com
Xpatulator.com is the most comprehensive source of international cost of living information. We provide free international cost of living overviews and rank information covering 13 cost of living baskets and every country around the world as well as premium content calculators.
 
Founded in 2007, Xpatulator.com’s mission is to organize the world’s cost of living indices, exchange rates and relative hardship indices and make it accessible and useful to all.
Posted in Uncategorized | Tagged , , , , , , | Comments Off on Europe Cost of Living Rankings for April 2012

Cost of Living Rankings for April 2012

The most expensive place to live in April 2012 is Tokyo based on the overall cost of living, encompassing all cost of living baskets. Zurich is the most expensive based on the cost of living excluding the housing, education, healthcare and transport baskets. Many companies cover these costs on behalf of the employee while on international assignments.

The latest international cost of living rankings are based on data collected during the past 3 months for 780 international locations, covering every country world-wide.

ImageThe cost of living (COL) data collected is representative of an expatriate lifestyle. The components of the COL data are local prices for fixed quantities of the same goods and services in each location, local inflation and exchange rates. Prices in each location are affected by availability (i.e. supply & demand) as well as local pricing regulations and taxes on goods and services (e.g.premiums on luxury brands). Local inflation is usually representative of local price increases which in turn impacts an expatriates purchasing power in the host country. The exchange rate impacts both the price of imports to the host country and the expatriate assignment salary calculation between the home and host country. The cost of living has a significant impact on the purchasing power of an expatriate’s salary package.

As the overall most expensive place to live, Tokyo has an overall cost of living index of 151.23, followed by Hong Kong with 145.93, and Zurich with 134.72. The overall index is comprised of 13 different basket groups. The assumption using the overall index is that everything is paid from the salary package. In addition, the cost of living calculations are weighted according to typical monthly international expatriate spending patterns. The Household Accommodation Basket for example, has a weighting of 30%, while the Groceries Basket has a weighting of 16.5%. That means that an international expatriate who, for example, earns 10,000 would typically spend 3,000 (30% of 10,000) on housing and 1,650 on groceries.

Of the top 50 most expensive destinations to live based on the overall cost of living, Asia-Pacific has 28 locations, Europe 12, the Americas 8, and Africa 2. The most expensive city in the Middle East is Abu Dhabi ranked 72, while in South Asia it is Mumbai ranked 366.

The top 50 Most expensive locations to live – Overall Cost of Living & All Baskets:

  1. Japan, Tokyo
  2. China, Hong Kong
  3. Switzerland, Zurich
  4. Switzerland, Geneva
  5. Japan, Yokohama
  6. Switzerland, All Areas
  7. Australia, Sydney
  8. Japan, Osaka
  9. Venezuela, Caracas
  10. Australia, Canberra
  11. Japan, Nagoya
  12. Japan, Kobe
  13. Brazil, Sao Paulo
  14. Japan, Kyoto
  15. Japan, Kawasaki
  16. Australia, Perth
  17. Australia, Melbourne
  18. China, Shanghai
  19. Singapore, Singapore
  20. Norway, Oslo
  21. Venezuela, All Areas
  22. Liechtenstein, Vaduz
  23. Brazil, Rio de Janeiro
  24. Japan, Fukuoka
  25. United Kingdom, London
  26. Norway, All Areas
  27. Angola, Luanda
  28. Russia, Moscow
  29. USA, New York (Manhattan) NY
  30. Liechtenstein, All Areas
  31. Australia, Brisbane
  32. Japan, All Areas
  33. Denmark, Copenhagen
  34. Japan, Sapporo
  35. New Zealand, Wellington
  36. Angola, All Areas
  37. USA, New York (Brooklyn) NY
  38. New Zealand, Auckland
  39. Denmark, All Areas
  40. Papua New Guinea, Port Moresby
  41. Brazil, Brasilia
  42. Korea Republic of, Seoul
  43. Australia, Adelaide
  44. Korea Republic of, Daegu
  45. Korea Republic of, Incheon
  46. Australia, All Areas
  47. USA, Honolulu HI
  48. Taiwan, Taipei
  49. Korea Republic of, Busan
  50. Monaco, Monaco
In many international assignments, basket groups such as housing, education, healthcare and transport are provided for by the employer, either in kind or in the form of an allowance over and above the salary. The reason why we would exclude these items, is to calculate the cost of living difference only for those items an expatriate would be responsible for paying for. If we take these basket items out of the cost of living calculation, the cost of living indexes change accordingly. On this basis the current cost of living index for Tokyo becomes 57.91, Hong Kong 42.45 (dropping all the way to rank 184) and Zurich 62.08. For an expatriate, where these benefits are provided for them, Zurich is the most expensive city to live based on what they would typically spend their salary on.
 
Of the top 50 most expensive places to live based on the cost of living excluding housing, education, healthcare and transport, Europe has 18 locations, the Americas 14, Asia-Pacific 13, and Africa 5. The most expensive city in the Middle East is Manama ranked 54, while in South Asia it is Kabul ranked 602.
 
The top 50 Most expensive places to live – Excluding Housing, Education, Healthcare and Transport Baskets:
 
  1. Switzerland, Zurich
  2. Switzerland, Geneva
  3. Russia, Moscow
  4. Switzerland, All Areas
  5. Brazil, Sao Paulo
  6. Venezuela, Caracas
  7. Japan, Tokyo
  8. Australia, Sydney
  9. Brazil, Rio de Janeiro
  10. Norway, Oslo
  11. USA, New York (Manhattan) NY
  12. Australia, Canberra
  13. Central African Republic, Bangui
  14. Norway, All Areas
  15. USA, New York (Brooklyn) NY
  16. Venezuela, All Areas
  17. Liechtenstein, Vaduz
  18. Australia, Melbourne
  19. Eritrea, Asmara
  20. USA, Honolulu HI
  21. Brazil, Brasilia
  22. Australia, Perth
  23. Denmark, Copenhagen
  24. Liechtenstein, All Areas
  25. Denmark, All Areas
  26. Solomon Islands, Honiara
  27. Eritrea, All Areas
  28. Russia, Vladivostok
  29. Monaco, Monaco
  30. Australia, Brisbane
  31. New Caledonia, Noumea
  32. Senegal, Dakar
  33. USA, New York (Queens) NY
  34. USA, San Francisco CA
  35. Azerbaijan, Baku
  36. Canada, Toronto
  37. France, Paris
  38. Russia, Kaliningrad
  39. Japan, Osaka
  40. Russia, St. Petersburg
  41. New Zealand, Wellington
  42. Italy, Rome
  43. Japan, Yokohama
  44. Angola, Luanda
  45. New Zealand, Auckland
  46. USA, New York NY
  47. USA, Hawaii All Areas HI
  48. USA, San Jose CA
  49. Russia, All Areas
  50. Australia, Adelaide
 
Switzerland and Japan dominate the rankings primarily due to their strong currencies which have made them relatively more expensive. Local inflation is far less of an influence on cost of living compared to changes in exchange rates. The impact of a strong currency is that imports become cheaper. For locally employed people, especially when purchasing imported goods and services, the cost of living may not seem to have a major negative impact. In fact overseas holidays become relatively cheap. However, it also means that Japan and Switzerland, as well as countries like Australia who have 6 cities in the top 50 based on overall cost of living, are relatively more expensive for those paying with foreign currency which impacts exports and the overall cost to an employer sending an assignee to work in these countries.
 
In addition to the impact of strong currencies, much of the developed world has historically embedded high cost of living structures that keep them amongst the most expensive places to live. Europe and America have 20 locations in the top 50 based on the overall cost of living index and 32 out of 50 places based on the cost of living excluding housing, education, healthcare and transport. The major factor contributing to this is the relatively higher level of pay in the developed world, particularly amongst lower level jobs. By contrast Africa, Asia-Pacific, the Middle East and South Asia have 30 places in the top 50 based on the overall cost of living index but only 18 out of 50 places based on the cost of living excluding housing, education, healthcare and transport.
 
To provide an assignee, sent to any of the most expensive countries, with a similar purchasing power to what they have in their home country, requires an adjustment to their assignment salary. The amount of adjustment depends on which country they come from. The larger the difference in cost of living, the larger the adjustment required to ensure a similar level of purchasing power in the host country.
Posted in Uncategorized | Tagged , , , | Comments Off on Cost of Living Rankings for April 2012

Expat Eye on the World


Being much more visual when it comes to gathering information or purely learning just about anything, I am always on the look out for videos that will help me achieve this.

Deciding to become an expat IS a big deal, especially when it is the first time you take on this type of an adventure. Like any adventure or trip the most interesting part of it is to research everything about the place you are going to, from accommodation, to schools, to entertainment and shopping. The best part of researching is finding interesting and realistic information and videos where you can visualize what to expect when you arrive. You can plan better and set yourself up for positive experiences rather than nasty surprises.

So it was with great delight that I found this website that does just that, although not all locations are on here it does give a pretty good visual idea of a lot of places on our world map.

And for cost of living information that is affordable for the man on the street and accurate, look at our comprehensive international cost of living information. This information will tell you what your cost of living expectations should be when moving from your current city to your new location.
We provide great visual website with free international cost of living reviews and  cost of living rankings covering 13 baskets with 300 international locations as well as 3 premium content calculators:

Cost of Living Index Calculator

Cost of Living Allowance Calculator

Salary Purchasing Power Parity Calculator

Click one of the Calculators to see
an example of a full report
Reports derived from the calculators cost US$99 each. Registration is free. There are no annual subscription charges.


Register, purchase credit online and use the calculators to create, run and receive your personalized report today. To get started Register Now
Posted in cost of living, cost of living allowance, cost of living calculator, cost of living comparison, cost of living index, cost of living ranking, Expatriate Relocation, international assignment, International Cost of Living | Tagged , | Comments Off on Expat Eye on the World

How to Calculate a Cost of Living Allowance – Part 3

The formula for calculating a cost of living allowance using the inputs discussed in part 2 are as follows:

(Net Spendable Salary X Cost of Living Index X Hardship Index X Exchange Rate) less (Net Spendable Salary X Exchange Rate) = COLA

Examples of COLA Calculations using our data

Example 1) An Australian employee with a net spendable salary of AUD$100,000 moving from Perth to London where healthcare and communication will be provided by the employer

($100,000.00 X 1.2806 X 1 X 0.4768) less ($100,000.00 X 0.4768) = COLA of £13,379.44 (GBP)

Based on all the above factors a person would require a Cost of Living Allowance of £13,379.44 (GBP), in addition to their current salary of 100,000.00 Australian Dollar (AUD) to compensate for relocating from Perth to London. This Cost of Living Allowance compensates for the overall cost of living difference of +28.06% and the relative difference in hardship of 0%.

Example 2) A British employee with a net spendable salary of £18,000 moving from London to Mumbai where the employer will provide housing and education

Note: Because the Cost of Living Index is negative it is not applied.

(£18,000.00 X 1 X 1.3 X 67.2852) less (£18,000.00 X67.2852) = COLA of 363,340.32 Indian Rupee

Based on all the above factors a person would require a Cost of Living Allowance of 363,340.32 (INR ), in addition to their current salary of £18,000.00 British Pound (GBP ) to compensate for relocating from London to Mumbai. This Cost of Living Allowance compensates for the overall cost of living difference of [-30.53%] and the relative difference in hardship of 30%.

COLA Payment
The COLA is paid as a salary supplement (i.e. as an additional allowance) net of tax in the host country. If the COLA is a taxable allowance in the host country it should be grossed up in order that the full amount of calculated COLA is paid net of tax given that the basis of the calculation is Net Spendable Salary. The COLA is often accompanied by other allowances and benefits such as flights home, relocation / settling in allowance, and furnishing allowance.

Exchange Rate Fluctuations
Significant changes in the exchange rate can make a considerable difference in the COLA calculation. In 2010-2011 some of the major global exchange rates changed by as much as 30-40%.

The cost of living index reflects the changes caused by inflation and exchange rates. In the short-term there may be disequilibrium between inflation and the exchange rate (the one pushes the other), however over time the cost of living index provides the most accurate view of the cost of living.

It is important to remind expatriates that when the cost of living difference is negative, and the negative value has not been applied, they have higher purchasing power in the host country than they would at home.

Where a negative cost of living index has not been applied (our recommended approach), and a change in the exchange rate indicates an upward adjustment in COLA may be required, it is recommended that the COLA should not be adjusted upward until the cost of living index becomes positive i.e. the cost of living reflects that there is a “real” increase in cost of living between home and host countries. This may mean that their would be no increase in the COLA as a result of exchange rate fluctuations for some considerable time. During this time the employee’s purchasing power decreases. But it is important to remember that until the cost of living difference becomes positive, the individual will still have a higher purchasing power than they do in their home country.

It is advisable to stipulate a currency protection rule, rather than reacting to every fluctuation in the exchange rate. For example the rule may state that COLA will be reviewed if exchange rates or local inflation move by more than +10% during a year. It is important to keep in mind that the prices of goods and services are unlikely to drop in local currency. This would only occur in a period of deflation (negative inflation). Therefore the currency protection rule would normally make provision for upward adjustments in COLA and not downward adjustments during an employee’s assignment. Downward adjustments to an existing COLA due to exchange rate fluctuations without a corresponding drop in the prices of local goods and services puts immense pressure on an employee’s host currency budget commitments and can lead to the employee experiencing financial difficulty.

Using an independent service provider provides an independent, objective basis for determining an employee’s COLA.

We recommend therefore that a COLA is calculated by applying the specific (customized) cost of living index to the net spendable salary at the beginning of the assignment and monitoring exchange rate fluctuations thereafter in addition to the annual salary review.

Posted in cost of living allowance | Tagged , | Comments Off on How to Calculate a Cost of Living Allowance – Part 3

How to Calculate a Cost of Living Allowance – Part 2

The formula for calculating the specific cost of living index for an international assignment is as follows:

Cost of Living Index = Customized Cost of Living Index for Host City / Customized Cost of Living Index for Home City

When moving to a higher cost of living host city, the index will be greater than 1 (positive). When moving to a lower cost of living host city the index will be less than 1 (negative). Where the index is negative it means that in real terms the cost of living in the host city is lower than the home city. This means that if the negative index where to be applied to the employee’s salary, they would actually be paid proportionately less spendable salary in the host city. It is important to note that the majority of organizations do not apply a negative cost of living index because it makes it difficult to persuade an employee to take up an assignment as they tend to see it as a reduction in salary.

Examples of Cost of Living Index Calculations using our data:

Example 1) An Australian employee moving from Perth to London where healthcare and communication will be provided by the employer

More Expensive in London:
Alcohol & Tobacco +4.77%
Clothing +21.85%
Education +31.53%
Furniture & Appliances +16.03%
Groceries +16.35%
Household +50.72%
Miscellaneous +137.47%
Personal Care +11.18%
Recreation & Culture -6.82%
Restaurants Meals Out and Hotels +34.99%
Transport +19.80%

The overall difference in cost of living moving from Perth and London is +28.06%.

In this case the cost of living index is positive and would be applied as it is.

Example 2) A British employee moving from London to Mumbai where the employer will provide housing and education

More Expensive in Mumbai:
Alcohol & Tobacco -37.53%
Clothing -9.58%
Communication -44.92%
Furniture & Appliances -19.31%
Groceries -24.03%
Healthcare -31.24%
Miscellaneous -72.43%
Personal Care -24.94%
Recreation & Culture -35.73%
Restaurants Meals Out and Hotels -33.11%
Transport is -27.99%

The overall difference in cost of living moving from London Mumbai is -30.53%.

In this case the cost of living index is negative and would not be applied.

Net Spendable Salary

Differences in cost of living only impact the portion of the salary that is spendable in the host country. Items in the home country such as retirement funding, medical insurance and other home based costs are not impacted by the cost of living in the host country.

To determine the Net Spendable Salary establish what amount / portion of the current salary (in home currency) is spent in maintaining the employee’s current standard of living / lifestyle. What will the expatriate need to spend their salary on in the host country? For example will accommodation be provided or will the employee pay rent, will healthcare be provided etc. Deduct all items that are either provided in kind or are spendable in the home country. Deduct the hypothetical amount of tax, social contributions and any other statutory deductions applicable in the home country from the Spendable Salary. What is left is the Net Spendable Salary.

In part 3 we discuss the formula for calculating a cost of living allowance using the above inputs
Posted in cost of living allowance, cost of living calculator, International Cost of Living | Tagged , , | 1 Comment

How to Calculate a Cost of Living Allowance – Part 1

A Cost of Living Allowance (COLA) is a salary supplement paid to employees to cover differences in the cost of living, particularly as a result of an international assignment.

The amount of COLA should enable an expatriate to be able to purchase the same basket of goods and services in the host location as they could in their home country. The basis for calculating a COLA is the Cost of Living Index (COLI) which indexes the costs of the same basket of goods and services in different geographic locations. COLA is a simple accurate method of measuring fluctuating salary purchasing power and ensuring parity.

Cost of Living Index
Xpatulator’s cost of Living Indexes measure the cost of 230 products and services across 13 different basket groups in 300 cities across the globe. The data is gathered by a team of research analysts who survey comparable items that are available internationally. A minimum of 3 prices for the same brand/size/volume of product is used to determine the average price for each item in each location. The items are priced on a quarterly basis and tend to rise and fall with inflation. The 13 different basket categories are as follows:

  1. Alcohol & Tobacco: Alcoholic beverages and tobacco products
  2. Clothing: Clothing and footwear products
  3. Communication
  4. Education
  5. Furniture & Appliances: Furniture, household equipment and household appliances
  6. Groceries: Food, non-alcoholic beverages and cleaning material
  7. Healthcare: General Healthcare, Medical and Medical Insurance
  8. Household Accommodation: Housing, water, electricity, household gas, household fuels, local rates and residential taxes
  9. Miscellaneous: Stationary, Linen and general goods and services
  10. Personal Care: Personal Care products and services
  11. Recreation and Culture
  12. Restaurants, Meals Out and Hotels
  13. Transport: Public Transport, Vehicle Costs, Vehicle Fuel, Vehicle Insurance and Vehicle Maintenance

Each basket category does not count equally and are weighted in the final calculation based on expatriate spending patterns.

In order to calculate an accurate cost of living index for a specific individual the basket items that are not relevant to the individual should be excluded from the calculation. For example if education and housing is provided by the employer these basket categories would be excluded from the cost of living index calculation. This increases the accuracy of the cost of living index and makes it possible for each individual to have their own customized cost of living index based on their specific arrangements rather than using an overall “generic” index which is likely to contains costs that are not relevant to the individual.

In part 2 we discuss the formula for calculating the specific cost of living index for an international assignment.

Posted in cost of living allowance, cost of living calculator, cost of living comparison, cost of living index, cost of living ranking | Tagged , , | Comments Off on How to Calculate a Cost of Living Allowance – Part 1

The Provisional 7Wonders of the World, is Your Country 1?

On the 11/11/11, just to make it ever so exciting with a special date line, the provisional 7Wonders of the World were announced. I wonder did you notice the announcement and if so did you notice who was nominated and who was left off the list?

Is your country’s wonder one of the wonders that made it, or just fell off or just did not figure?  Take a quick look here and see for yourself….Listed in alphabetical order just to ensure no one gets upset.

1. The Amazon River

Runs through Bolivia, Brazil, Colombia, Ecuador, French Guiana, Guyana,Peru, Suriname, and Venezuela. The Amazonia, the Amazon jungle and the Amazon Basin, encompasses a massive seven million square kilometers i.e. 1.7 billion acres.  The Amazon forest occupies 5.5 million square kilometers of this (1.4 billion acres) lying within nine nations.  The Amazon comprises over half of the planet’s remaining rainforests and has the largest and most species-rich tract of tropical rainforest in the world.  With the Amazon River being the largest river in the world by volume, it accounts for one-fifth of the total worlds river flow, it has the biggest drainage basin on the planet, contains creatures that are still being discovered and has a total flow greater than the top ten rivers combined worldwide. Even more interesting is that not one single bridge crosses the Amazon.

2. Halong Bay

Found in the Quang Ninh province of Vietnam, has a 120 kilometer coastline and is approximately 1,553 square kilometers in size with 1969 islets. lt features thousands of limestone karsts and isles in various sizes and shapes.  Several of the islands found along the coastline are hollow with enormous caves, and an abundance of lakes inside the limestone islands which occupy drowned dolines within fengcong karst.  Some of the islands support floating fishing villages, who ply the shallow waters for the 200 species of fish and 450  different kinds of mollusks.

3. Iguaza Falls

Iguaza Falls is made up collectively of 275 smaller falls and is found in the Iguaza River Argentina Brazil. It is one of the world’s largest waterfalls with the tallest fall called the “Devil’s Throat” being the tallest at 80m.  The falls extend to over 2,700 meters (almost 2 miles) and are shaped in a semi-circle. The falls are surrounded by two National Parks (BR/ARG) and are found on the border between the Brazilian State of Parana and the Argentine province of Misiones, both being subtropical rainforest areas which host hundreds of rare and endangered species of flora and fauna.

4.Jeju Island

Jeju Island (Jejudo) is a volcanic island found 130 kilometers from the southern coast of Korea, it has a surface area of 1,846 square kilometers and is the largest island and smallest province in the country. The dormant volcano on the island is the tallest mountain in South Korea rising 1,950 m above sea level with 360 satellite volcanoes forming around the main volcano.

5. Komodo National Park

Found in Indonesia, the park includes the three larger islands Komodo, Rinca and Padar, including some smaller ones of volcanic origin, making up a total area of 1,817 square kilometers (603 square kilometers of it land). Founded in 1980 to protect the Komodo dragon, and later dedicated to protecting other species as well as marine animals.

6. PP Underground River

The Philippines boasts the Puerto Princesa Subterranean River National Park which is located approximately 50 kilometers north of the city of Puerto Princesa, Palawan. Its main feature is a limestone karst mountain landscape with an 8.2 kilometers navigable underground river. It winds through a cave with major formations of stalactites and stalagmites with several large chambers with the lower portion of the river being subjedt to tidal influences, before flowing directly into the South China Sea.  The underground river is reputed as the world’s longest, at the mouth of the cave, a clear lagoon is framed by ancient trees growing right to the water’s edge, monkeys, large lizards and squirrels find their niche on the beach near the cave.

7. Table Mountain

A national icon situated in South Africa, it is the only natural site on the planet to have a constellation of stars named after it – Mensa, meaning “the table”. The gateway to Africa and the most recognized site in Cape Town owing to its unique flat-topped peaks reach up to 1,086 m above sea level. This flat-topped mountain hosts the richest and smallest floral kingdom on earth with over 1,470 floral species, hosting rare and endangered species.

Confirmed winners will be announced at the Official Inauguration ceremony in 2012.

Is your country one of the above?  If not find it here.

Posted in Uncategorized | Tagged , | Comments Off on The Provisional 7Wonders of the World, is Your Country 1?

Cost of Living – Household Accommodation – October 2011

Cost of living rank of Household cost of living indexes as at October 2011 for 300 global locations. The indexes are calculated using the prices for specific quantities of the same goods and services in each location, based on expatriate spending patterns across 13 broad categories (Basket Groups). The calculators make use of the cost of living indexes, based on your input and Xpatulator’s data, to create reports online which you can save, e-mail or convert to a pdf file.


Household costs include housing, water, electricity, household gas, household fuels, local rates and residential taxes such as house / flat mortgage, house / flat rental, household electricity consumption, household gas / fuel consumption, household water consumption, and local property rates / taxes / levies.


Xpatulator.com is the most comprehensive source of international cost of living index information.


Premium Content Calculators:


The SPPP report calculates how much you need to earn in another location to compensate for a higher cost of living, hardship, and the exchange rate, in order to have the same relative spending power and as a result have a similar standard of living as you have in your current location. Each new SPPP report uses 1 credit ($99). Recommended for a detailed comparison of 2 locations.


The COLA report calculates how much additional allowance (over and above your current salary) you need to earn in another location to compensate for a higher cost of living, hardship and the exchange rate, in order to have the same relative spending power and as a result have a similar standard of living as you have in your current location. Each new COLA report uses 1 credit ($99). Recommended for calculation of a cost of living allowance for short-term assignments.


The COLI report calculates cost of living indexes for the host locations you select, using the home location you specify. You can choose from any one of the 13 baskets or you can choose the overall cost of living index. Each new COLI report uses 1 credit ($99) allowing you to choose 1 home location and up to 300 available host locations.Recommended for the calculation of 3 or more cost of living indexes using your choice of base city.


1 credit costs $99. Register, buy credits online and you can run the premium content calculators and receive your reports online within minutes.


The October 2011 household international cost of living rank is as follows:


October 2011 Rank Country, City


1 Japan, Tokyo
2 China, Hong Kong
3 Japan, Osaka
4 Japan, Nagoya
5 Japan, Yokohama
6 China, Shanghai
7 Taiwan, Taipei
8 Korea Republic of, Seoul
9 Singapore, Singapore
10 Angola, Luanda
11 Switzerland, Geneva
12 Switzerland, Zurich
13 United Arab Emirates, Abu Dhabi
14 United Kingdom, London
15 Croatia, Zagreb
16 Australia, Sydney
17 Czech Republic, Prague
18 United Kingdom, Glasgow
19 Liechtenstein, Vaduz
20 Qatar, Doha
21 Australia, Canberra
22 Bahamas, Nassau
23 United Kingdom, Birmingham
24 Jersey, Saint Helier
25 United Kingdom, Leeds
26 Falkland Islands, Stanley
27 Venezuela, Caracas
28 Australia, Perth
29 Isle of Man, Douglas
30 Guernsey, St Peter Port
31 Australia, Melbourne
32 United Kingdom, Belfast
33 USA, New York NY
34 Papua New Guinea, Port Moresby
35 Saint Helena, Jamestown
36 United Arab Emirates, Dubai
37 Russia, Moscow
38 Australia, Brisbane
39 Monaco, Monaco
40 Finland, Helsinki
41 New Zealand, Auckland
42 Denmark, Copenhagen
43 France, Paris
44 Micronesia, Palikir
45 Brazil, Sao Paulo
46 Australia, Adelaide
47 Bermuda, Hamilton
48 Saudi Arabia, Riyadh
49 Nigeria, Lagos
50 Italy, Milan
51 Brazil, Rio de Janeiro
52 Italy, Rome
53 France, Marseille
54 France, Lyon
55 Serbia, Belgrade
56 Norway, Oslo
57 Ghana, Accra
58 Cuba, Havana
59 San Marino, San Marino
60 Trinidad and Tobago, Port-of-Spain
61 Brazil, Brasilia
62 Cote DIvoire, Abidjan
63 Saudi Arabia, Jeddah
64 Dominican Republic, Santo Domingo
65 USA, San Jose Calif
66 Cape Verde, Praia
67 Israel, Jerusalem
68 Canada, Toronto
69 Equatorial Guinea, Malabo
70 Tanzania, Dar es Salaam
71 Cook Islands, Avarua
72 Ukraine, Kiev
73 Lebanon, Beirut
74 Cayman Islands, George Town
75 Russia, St. Petersburg
76 Uruguay, Montevideo
77 Ireland, Dublin
78 Chile, Santiago
79 China, Beijing
80 New Caledonia, Noumea
81 Sweden, Stockholm
82 Vatican City, Vatican City
83 Canada, Calgary
84 Vanuatu, Port Vila
85 Canada, Vancouver
86 Nauru, Yaren
87 Panama, Panama City
88 USA, San Francisco Calif
89 Portugal, Lisbon
90 Liberia, Monrovia
91 Marshall Islands, Majuro
92 Austria, Vienna
93 Germany, Munich
94 Syria, Damascus
95 Canada, Montreal
96 Belgium, Brussels
97 Colombia, Bogota
98 Iceland, Reykjavik
99 South Africa, Johannesburg
100 India, Mumbai
101 Iran, Tehran
102 Thailand, Bangkok
103 Luxembourg, Luxembourg
104 Algeria, Algiers
105 Hungary, Budapest
106 USA, Washington DC
107 Malaysia, Kuala Lumpur
108 Greenland, Nuuk
109 Gabon, Libreville
110 Moldova, Chisinau
111 Germany, Frankfurt
112 Palestinian Territories, West Bank
113 Chad, NDjamena
114 Germany, Cologne
115 Spain, Madrid
116 Poland, Warsaw
117 Bahrain, Manama
118 Canada, Ottawa
119 Montenegro, Podgorica
120 Jamaica, Kingston
121 Martinique, Fort-de-France
122 Mali, Bamako
123 Slovakia, Bratislava
124 Egypt, Cairo
125 Barbados, Bridgetown
126 Mexico, Mexico City
127 Brunei, Bandar Seri Begawan
128 India, Calcutta
129 South Africa, Cape Town
130 Spain, Barcelona
131 South Africa, Pretoria
132 Germany, Hamburg
133 Guinea, Conakry
134 Puerto Rico, San Juan
135 India, New Delhi
136 India, Chennai
137 Congo Democratic Rep, Kinshasa
138 Azerbaijan, Baku
139 Estonia, Tallinn
140 Greece, Athens
141 India, Hyderabad
142 China, Wuhan
143 South Africa, Durban
144 Zambia, Lusaka
145 Philippines, Manila
146 China, Shenzhen
147 China, Dalian
148 Solomon Islands, Honiara
149 Sao Tome and Principe, Sao Tome
150 Andorra, Andorra la Vella
151 Guadeloupe, Basse-Terre
152 USA, Boston Mass
153 USA, Los Angeles Calif
154 Macedonia, Skopje
155 Palau, Melekeok
156 Netherlands, Amsterdam
157 Mozambique, Maputo
158 India, Bangalore
159 Sierra Leone, Freetown
160 Kazakhstan, Almaty
161 China, Guangzhou
162 Argentina, Buenos Aires
163 Gibraltar, Gibraltar
164 Senegal, Dakar
165 Indonesia, Jakarta
166 Guam, Hagatna
167 French Polynesia, Papeete
168 Seychelles, Victoria
169 USA, San Diego Calif
170 Turkey, Istanbul
171 Namibia, Windhoek
172 Lithuania, Vilnius
173 Peru, Lima
174 Germany, Berlin
175 Germany, Bonn
176 Pakistan, Lahore
177 Tuvalu, Funafuti
178 Fiji, Suva
179 Oman, Muscat
180 Slovenia, Ljubljana
181 Georgia Republic of, Tbilisi
182 Vietnam, Hanoi
183 Djibouti, Djibouti
184 Romania, Bucharest
185 USA, Baltimore Md
186 Guinea-Bissau, Bissau
187 USA, Philadelphia Pa
188 Uganda, Kampala
189 Pakistan, Islamabad
190 China, Tianjin
191 Northern Mariana Islands, Saipan
192 Jordan, Amman
193 Pakistan, Karachi
194 Antigua and Barbuda, Saint Johns
195 Vietnam, Ho Chi Minh City
196 Sudan, Khartoum
197 Guatemala, Guatemala City
198 Turkey, Ankara
199 Kosovo, Pristina
200 Morocco, Rabat
201 Costa Rica, San Jose
202 Central African Republic, Bangui
203 Haiti, Port-au-Prince
204 Belarus, Minsk
205 Maldives, Male
206 USA, Chicago Ill
207 El Salvador, San Salvador
208 Malta, Velletta
209 Saint Kitts and Nevis, Basseterre
210 Albania, Tirana
211 Lesotho, Maseru
212 Paraguay, Asuncion
213 Kuwait, Kuwait City
214 Honduras, Tegucigalpa
215 Cyprus, Nicosia
216 Cambodia, Phnom Penh
217 Grenada, Saint Georges
218 Comores, Moroni
219 USA, Portland Ore
220 Myanmar, Yangon
221 Cameroon, Douala
222 Guyana, Georgetown
223 Zimbabwe, Harare
224 USA, Detroit Mich
225 French Guiana, Cayenne
226 USA, Anchorage AK
227 Belize, Belmopan
228 Cameroon, Yaounde
229 Kenya, Nairobi
230 Tunisia, Tunis
231 Samoa, Apia
232 USA, Miami Fla
233 Saint Vincent and the Grenadines, Kingstown
234 Malawi, Lilongwe
235 Benin, Cotonou
236 Sri Lanka, Colombo
237 Turkmenistan, Ashgabat
238 Somalia, Mogadishu
239 USA, Las Vegas Nev
240 Rwanda, Kigali
241 Afghanistan, Kabul
242 Swaziland, Mbabane
243 USA, Seattle Wash
244 USA, Milwaukee Wis
245 Togo, Lome
246 USA, Tampa Fla
247 Kiribati, South Tarawa
248 Suriname, Paramaribo
249 USA, Phoenix Ariz
250 Madagascar, Antananarivo
251 USA, Cleveland Ohio
252 Ecuador, Quito
253 USA, Denver Colo
254 Dominica, Roseau
255 Armenia, Yerevan
256 Uzbekistan, Tashkent
257 USA, Charlotte NC
258 USA, Columbus Ohio
259 Burkina Faso, Ouagadougou
260 USA, Jacksonville Fla
261 Botswana, Gaborone
262 Libya, Tripoli
263 Niger, Niamey
264 Mauritius, Port Louis
265 Laos, Vientiane
266 Latvia, Riga
267 Nicaragua, Managua
268 Bangladesh, Dhaka
269 USA, Pittsburgh Penn
270 Bosnia and Herzegovina, Sarajevo
271 USA, Dallas Tex
272 USA, Indianapolis Ind
273 Ethiopia, Addis Ababa
274 Tajikistan, Dushanbe
275 Mongolia, Ulaanbaatar
276 USA, Fort Worth Tex
277 USA, Austin Tex
278 Bulgaria, Sofia
279 Kyrgyzstan, Bishkek
280 USA, Houston Tex
281 USA, San Antonio Tex
282 Mauritania, Nouakchott
283 USA, Atlanta GA
284 USA, El Paso Tex
285 Gambia, Banjul
286 Timor-Leste, Dili
287 USA, Memphis Tenn
288 USA, St Louis MO
289 Saint Lucia, Castries
290 Bolivia, La Paz
291 China, Macao
292 Iraq, Baghdad
293 Burundi, Bujumbura
294 Nepal, Kathmandu
295 Yemen, Sanaa
296 Korea Democratic Republic of, Pyongyang
297 Bhutan, Thimphu
298 Congo, Brazzaville
299 Tonga, NukuAlofa
300 Eritrea, Asmara


This article may be freely copied as long as reference is made to http://www.xpatulator.com/

Posted in Uncategorized | Tagged , , , , | Comments Off on Cost of Living – Household Accommodation – October 2011