
International cost of living rankings are often interpreted as a measure of inflation. In reality, exchange rates can be just as important.
Xpatulator’s city data as at 1 October 2026 illustrates the point. Monaco remains 1st globally, Hong Kong, China 2nd and Singapore rises to 3rd. Manhattan moves to 4th while Zurich falls 2 places to 5th. Further down the ranking, London falls to 13th, Copenhagen to 16th and Wellington to 19th.
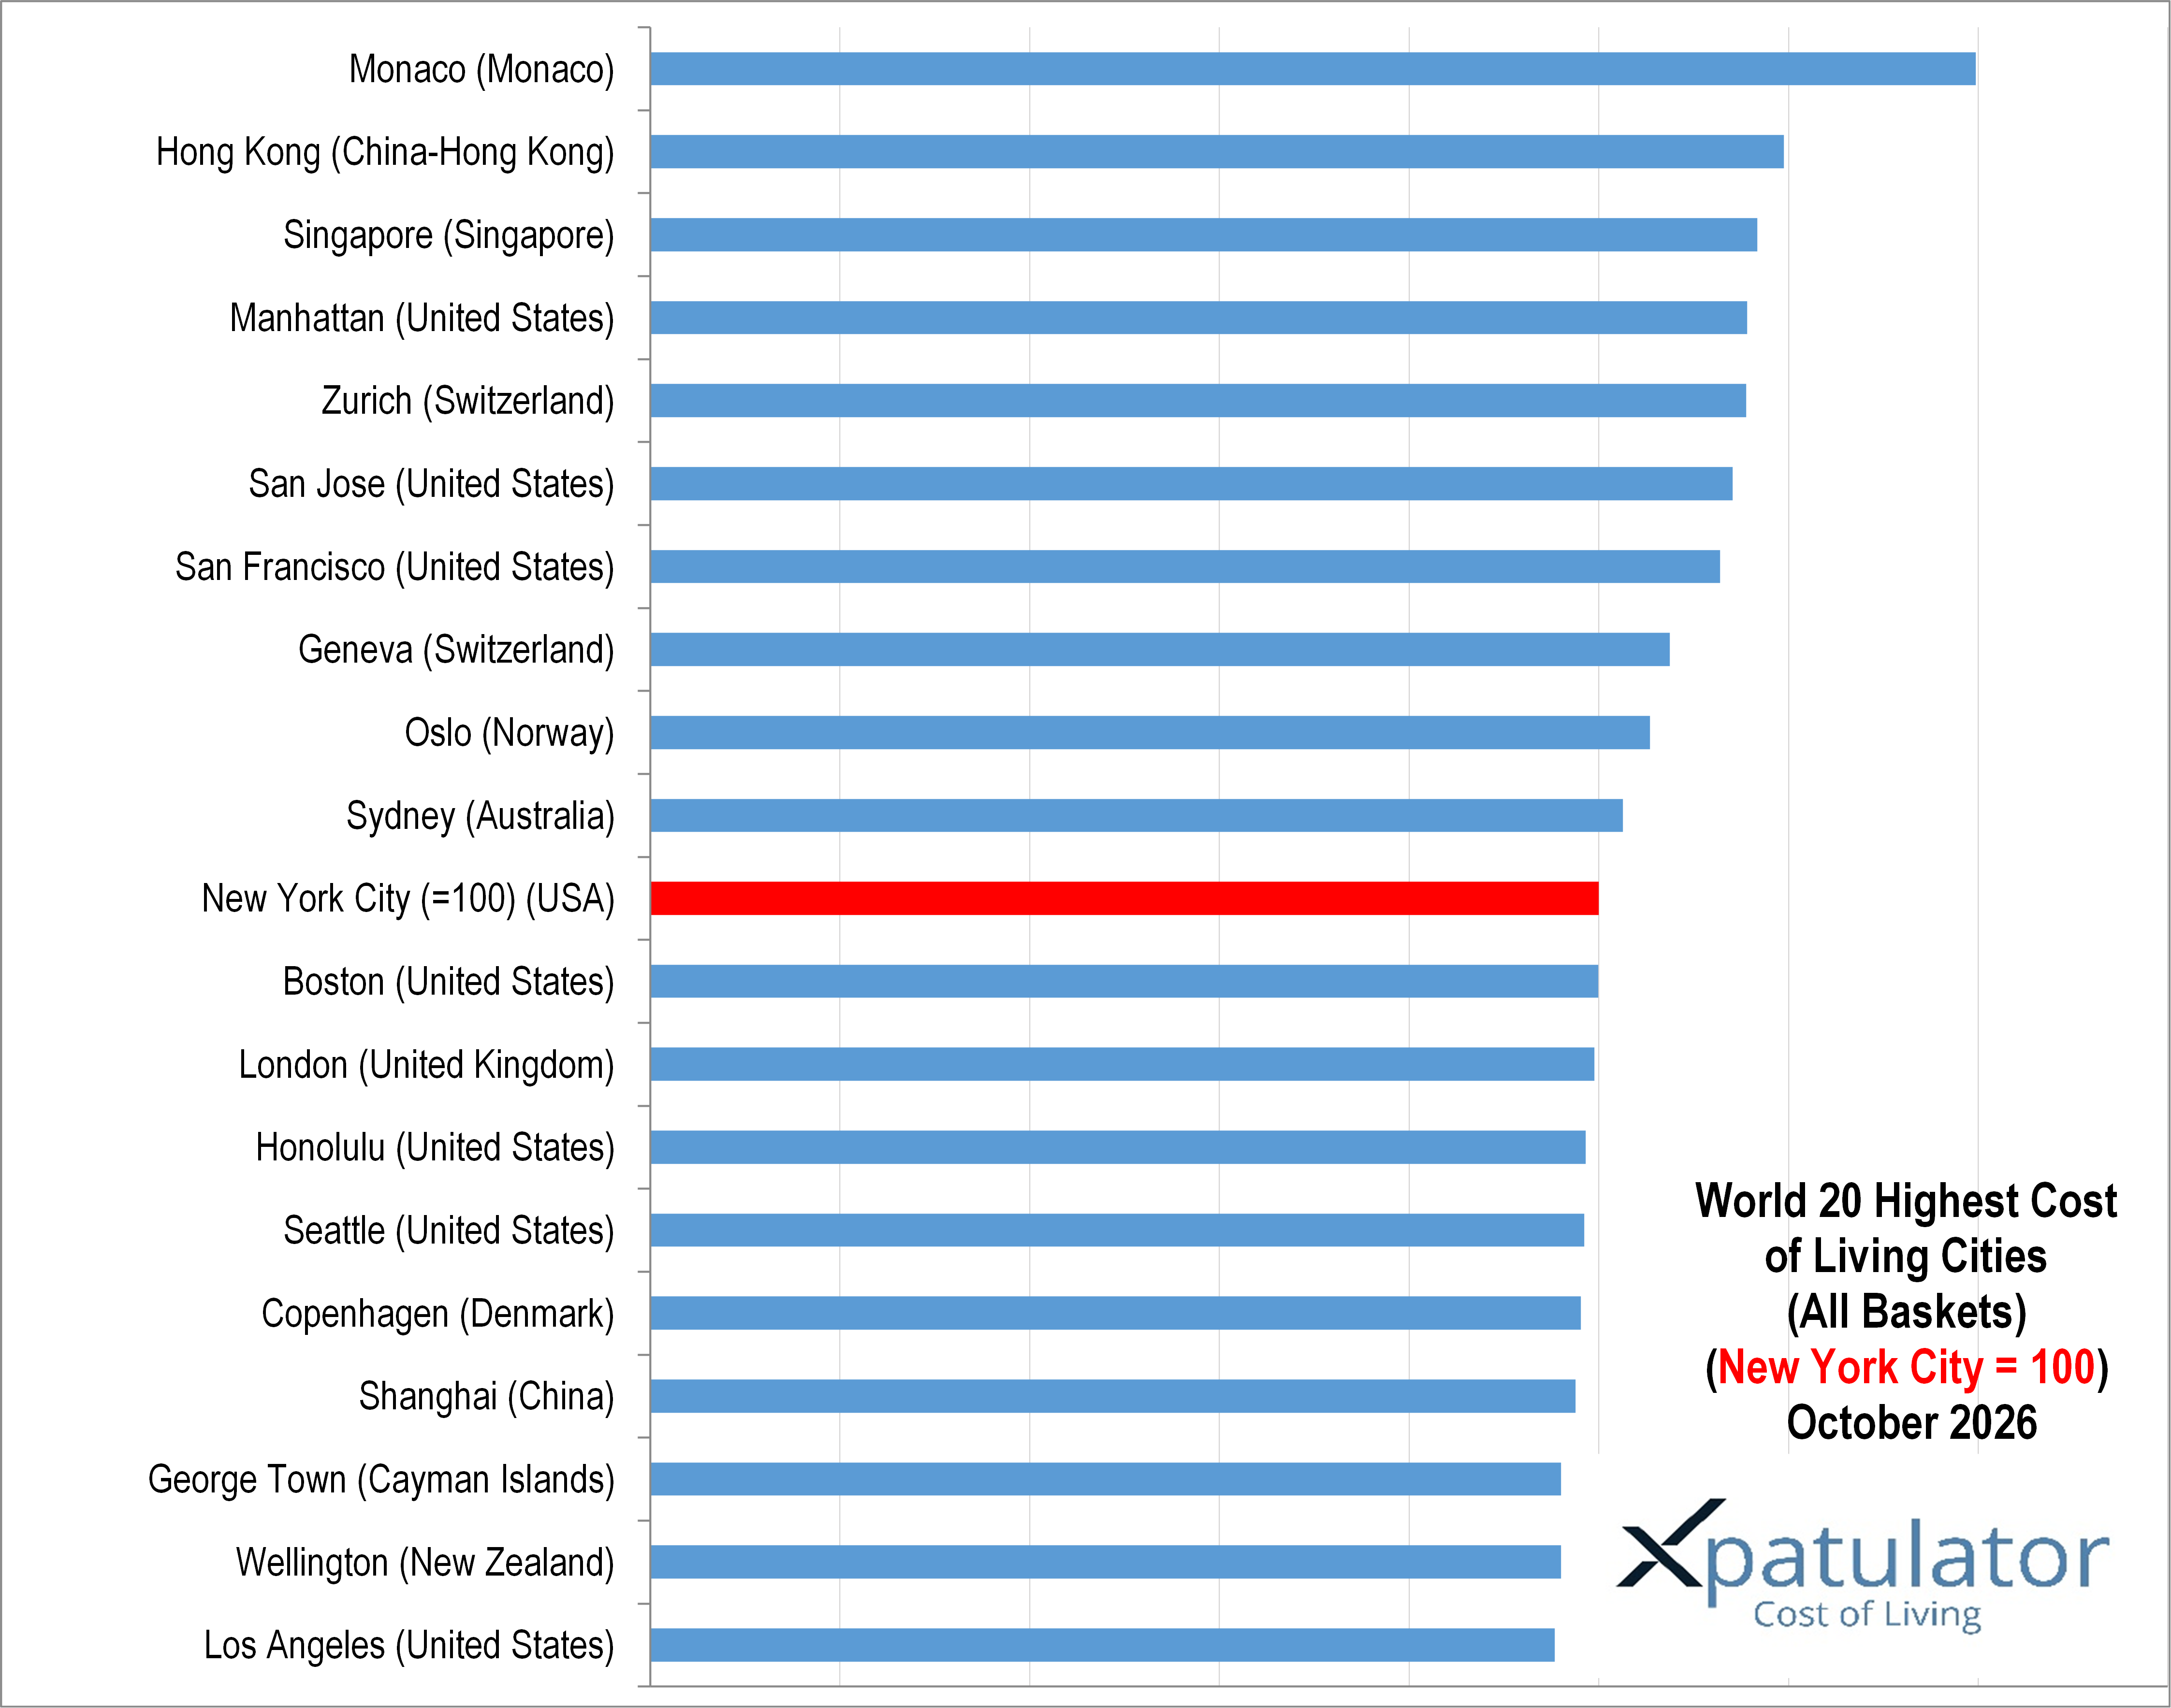
Several of those changes coincide with currency movements. At the end of September 2026, the euro bought fewer United States dollars than a year earlier. The Swiss franc and pound sterling were also weaker against the United States dollar, while the New Zealand dollar declined over the same period.
A weaker host currency makes local expenditure less expensive when converted into United States dollars. This can lower a city’s international Cost of Living Index even while rents, energy and services continue to rise locally. It helps explain why Zurich, London, Copenhagen and Wellington moved lower in the rankings.
The reverse is also possible. The Australian dollar, Singapore dollar, Chinese yuan and Norwegian krone were stronger against the United States dollar at the end of September than a year earlier. A stronger host currency raises the dollar value of local expenditure, although local price movements can offset the effect. Sydney, for example, retains 10th place despite a lower index, while Shanghai rises 3 places to 17th.
Hong Kong is different because its currency operates within a linked exchange rate band of 7.75 to 7.85 Hong Kong dollars to one United States dollar. Foreign exchange therefore has much less direct influence on its ranking than in cities with freely moving currencies. Housing remains the dominant factor, with Hong Kong’s accommodation index at 179.6.
Inflation further complicates the comparison. Singapore’s consumer prices were 2.3 per cent higher in August than a year earlier. Australian inflation reached 4.0 per cent, with housing up 5.7 per cent. Euro area inflation was 3.8 per cent in September, while China continued to experience relatively subdued price pressure.
Global energy conditions are adding another layer. Middle East instability has kept oil above 100 United States dollars per barrel, while shipping and insurance costs for energy flows have increased sharply. These pressures matter well beyond oil producing regions. Higher fuel costs affect aviation, freight, food distribution and utilities, placing import dependent cities such as Honolulu, George Town, Singapore and Wellington at particular risk.
This is why a nominal salary comparison can be misleading. An employee may receive a higher salary after moving abroad but still have less disposable income if housing, education, healthcare and transport are more expensive or if the host currency strengthens.
A useful comparison therefore asks how much salary is required in the host location to buy the same basket of goods and services as at home. Xpatulator’s Salary Purchasing Power Parity Calculator is designed for precisely this purpose, converting cost of living differences into an equivalent host salary so that an international offer can be assessed in terms of actual purchasing power rather than its headline amount.


